FractalVolty_v1
Download script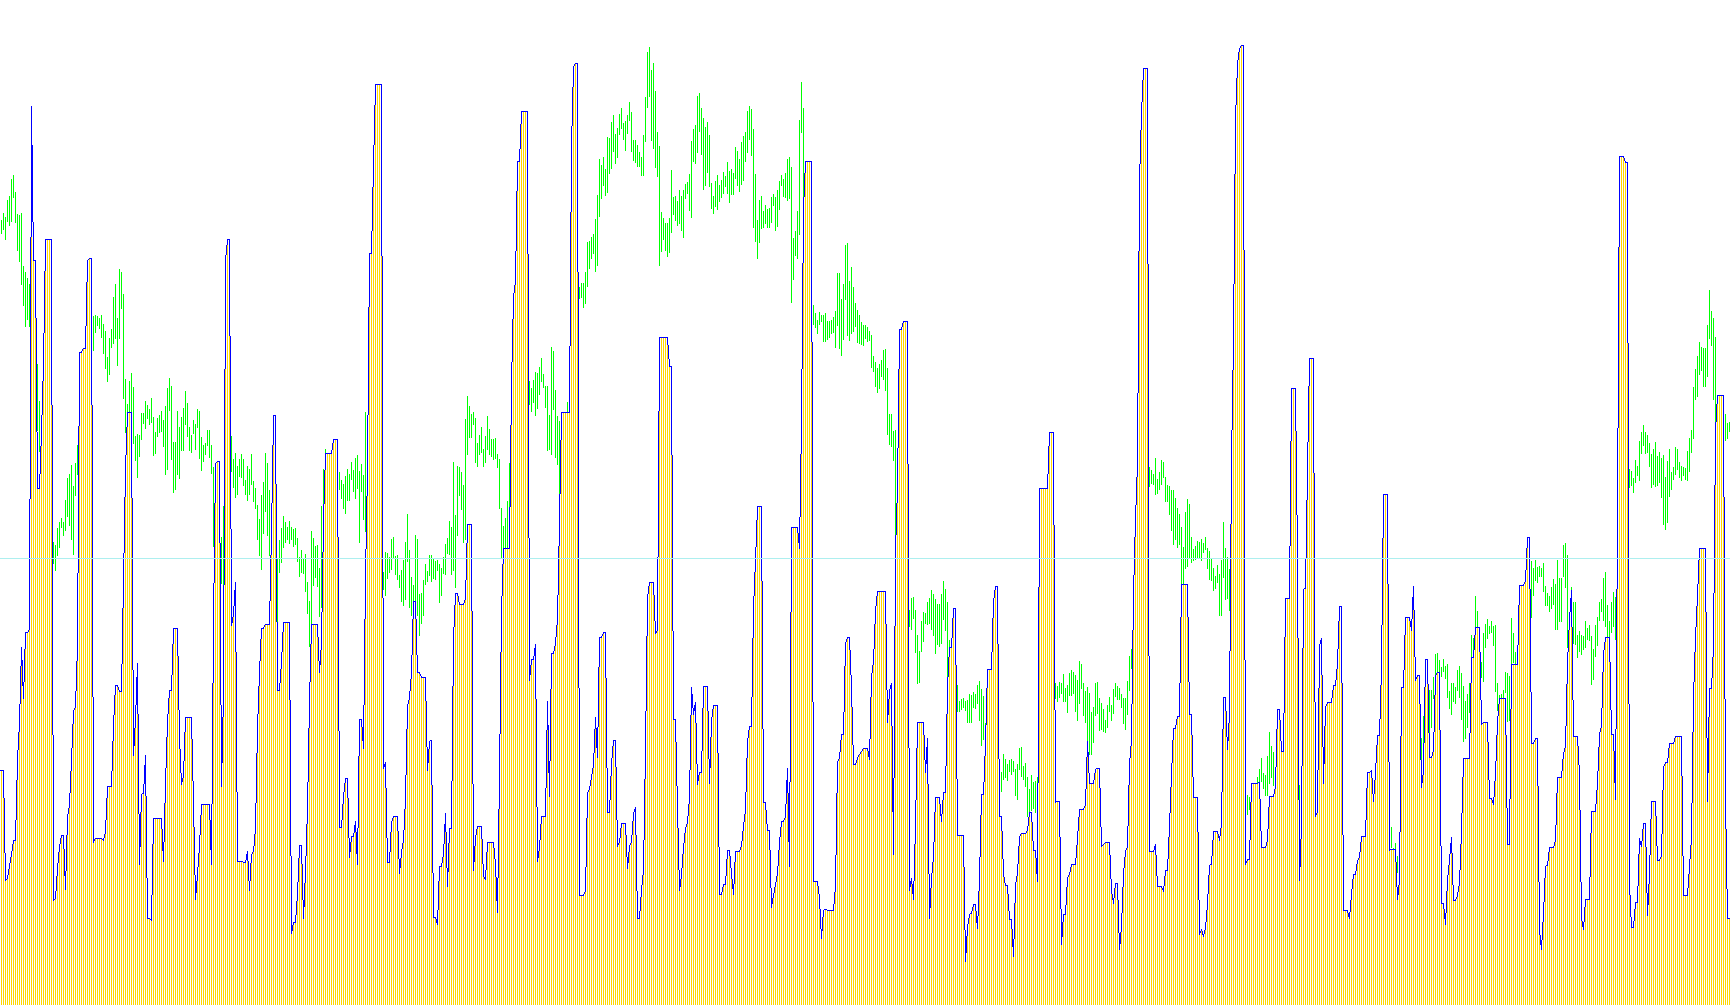
This technical tool, known as the Fractal Volty, is designed to provide traders with a visual representation of market volatility by identifying and measuring specific structural price points. Instead of simply looking at how fast price moves, this script focuses on "fractals"—the peaks and valleys that define the overall shape of a trend.
Core Logic & Mechanics
The script operates through a multi-step process to translate raw price data into a readable volatility signal:
1. Fractal Identification The tool first scans recent price history to find significant high and low points. Depending on the user's settings, it looks for different "strengths" of these peaks:
- It compares the current candle against several previous candles to see if a specific peak is higher than those surrounding it.
- By identifying these local maximums (highs) and minimums (lows), the script establishes the boundaries of the market's recent movement.
2. Dynamic Range Calculation Once these highs and lows are identified, the script tracks the "highest high" and "lowest low" over a continuous sequence. It then calculates the distance between these two extremes. This distance represents the current range of price action. The primary indicator (displayed as a histogram) shows half of this total range, providing a normalized view of how much the market is expanding or contracting.
3. Smoothing and Averaging To prevent the data from being too erratic or "noisy," the script applies a moving average to the volatility readings. This smooths out minor price fluctuations and highlights the broader trend of market expansion or compression.
4. The Trigger Mechanism Finally, the tool calculates a weighted "Trigger" line based on the average volatility over a specific period. By multiplying this average by a user-defined sensitivity factor (Kv), it creates a benchmark. Traders can then observe how the current volatility compares to this baseline to identify periods of unusual activity or potential trend exhaustion.
Summary for the User
In simple terms, this script ignores the "noise" of every small price tick and instead focuses on the significant "landmarks" of the market. It measures the distance between these landmarks to tell you how much the market is swinging. By smoothing that data into a line and a histogram, it helps you see whether the market is currently in a state of high-intensity expansion or quiet consolidation.
//+------------------------------------------------------------------+
//|                                              FractalVolty_v1.mq4 |
//|                                  Copyright © 2006, Forex-TSD.com |
//|                         Written by IgorAD,igorad2003@yahoo.co.uk |
//|            http://finance.groups.yahoo.com/group/TrendLaboratory |
//+------------------------------------------------------------------+
#property copyright "Copyright © 2006, Forex-TSD.com "
#property link      "http://www.forex-tsd.com/"

#property indicator_separate_window
#property indicator_minimum -0.0005
#property indicator_buffers 3
#property indicator_color1 Yellow
#property indicator_color2 Tomato
#property indicator_color3 DodgerBlue
//---- input parameters
extern int     Type=1;
extern int     PeriodMA=1;
extern double  Kv =1.0;
//---- buffers
double VoltyBuffer[];
double SmoothBuffer[];
double TriggBuffer[];
double v1[];
double v2[];
double smin[];
double smax[];
//+------------------------------------------------------------------+
//| Custom indicator initialization function                         |
//+------------------------------------------------------------------+
int init()
  {
   string short_name;
//---- indicator line
   IndicatorBuffers(7);
   SetIndexStyle(0,DRAW_HISTOGRAM);
   SetIndexStyle(1,DRAW_LINE);
   SetIndexStyle(2,DRAW_LINE);
   SetIndexBuffer(0,VoltyBuffer);
   SetIndexBuffer(1,SmoothBuffer);
   SetIndexBuffer(2,TriggBuffer);
   SetIndexBuffer(3,v1);
   SetIndexBuffer(4,v2);
   SetIndexBuffer(5,smin);
   SetIndexBuffer(6,smax);
//---- name for DataWindow and indicator subwindow label
   short_name="FractalVolty("+Type+","+PeriodMA+","+DoubleToStr(Kv,2)+")";
   IndicatorShortName(short_name);
   SetIndexLabel(0,"Volty");
   SetIndexLabel(1,"Smoothed");
   SetIndexLabel(2,"Trigger");
//----
   SetIndexDrawBegin(0,2*Type+PeriodMA);
   SetIndexDrawBegin(1,2*Type+PeriodMA);
   SetIndexDrawBegin(2,2*Type+PeriodMA);
//----
   return(0);
  }
//+------------------------------------------------------------------+
//| FractalChannel_v1                                                         |
//+------------------------------------------------------------------+
int start()
{
int  	   shift, counted_bars=IndicatorCounted();
double   Sum,Volmid,
			High0,High1,High2,High3,High4,High5,High6,
			Low0,Low1,Low2,Low3,Low4,Low5,Low6;

   if ( counted_bars > 0 )  int limit=Bars-counted_bars;
   if ( counted_bars < 0 )  return(0);
   if ( counted_bars < 1 )
     for(shift=1;shift<=2*Type+PeriodMA;shift++)
     {VoltyBuffer[Bars-shift]=0;SmoothBuffer[Bars-shift]=0;TriggBuffer[Bars-shift]=0;
     smax[Bars-shift]=0;smin[Bars-shift]=0;v1[Bars-shift]=0;v2[Bars-shift]=0;}

   if ( counted_bars ==0 )  limit=Bars-2*Type-PeriodMA-1;

	for(shift=limit;shift>=0;shift--)
   {
   v1[shift]=-1;
	v2[shift]=-1;

	High0=High[shift];
	High1=High[shift+1];
	High2=High[shift+2];
	High3=High[shift+3];
	High4=High[shift+4];
	High5=High[shift+5];
	High6=High[shift+6];

	Low0=Low[shift];
	Low1=Low[shift+1];
	Low2=Low[shift+2];
	Low3=Low[shift+3];
	Low4=Low[shift+4];
	Low5=Low[shift+5];
	Low6=Low[shift+6];

	if (Type==1)
	{
	if (High2<=High1 && High0<High1) v1[shift]=High1;
	if (Low2>=Low1 && Low0>Low1) v2[shift]=Low1;
	}

	if (Type==2)
	{
	if (High4<=High2 && High3<=High2 && High0<High2 && High1<High2)
	v1[shift]=High2;
	if (Low4>=Low2 && Low3>=Low2 && Low0>Low2 && Low1>Low2)
	v2[shift]=Low2;
	}

	if (Type==3)
	{
	if (High6<=High3 && High5<=High3 && High4<=High3 &&
	High0<High3 && High1<High3 && High2<High3)
	v1[shift]=High3;
	if (Low6>=Low3 && Low5>=Low3 && Low4>=Low3 &&
	Low0>Low3 && Low1>Low3 && Low2>Low3)
	v2[shift]=Low3;
	}

	smax[shift]=smax[shift+1];
	if ( v1[shift]>0 ) smax[shift]=v1[shift];
	if (High0>smax[shift]) smax[shift]=High0;
	smin[shift]=smin[shift+1];
	if ( v2[shift]>0 ) smin[shift]=v2[shift];
	if (Low0<smin[shift]) smin[shift]=Low0;
	VoltyBuffer[shift]=(smax[shift]-smin[shift])/2;
	}

	Sum = 0;
	for (shift=Bars-1-2*Type-PeriodMA;shift>=0;shift--)
	{
	SmoothBuffer[shift]=iMAOnArray(VoltyBuffer,0,PeriodMA,0,MODE_SMA,shift);
	Sum=Sum+VoltyBuffer[shift];
	}
	Volmid=Sum/(Bars-2*Type-PeriodMA);

	for (shift=Bars-1-2*Type-PeriodMA;shift>=0;shift--)
	{
	TriggBuffer[shift]=Kv*Volmid;
	}


return(0);
}


//+------------------------------------------------------------------+
Comments