FTLM-STLM_MTF
Download script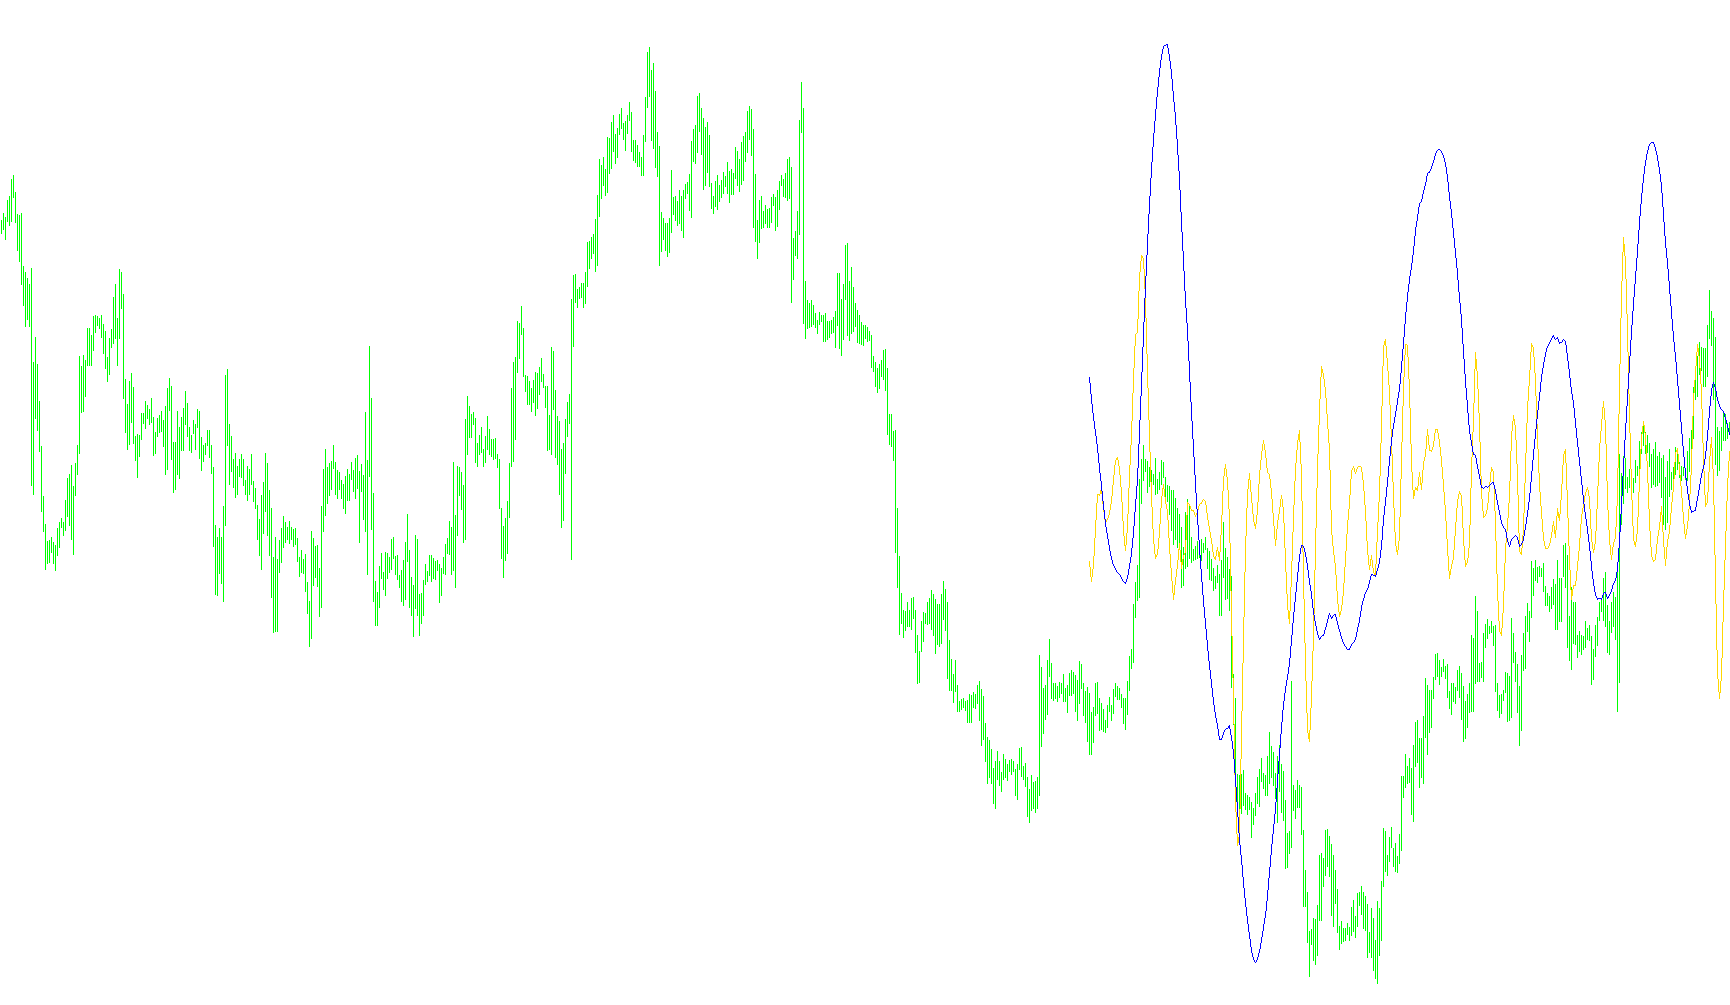
This tool is designed to provide traders with a multi-timeframe perspective on market trends by overlaying historical data from higher timeframes onto your current chart. Rather than forcing you to switch between different windows to see the "big picture," this script synchronizes larger price movements with your immediate trading timeframe.
How it Works
The primary logic of this script revolves around Timeframe Alignment. It retrieves specific trend data from a larger timeframe (such as Daily, Weekly, or Hourly charts) and maps those values onto the smaller timeframe you are currently viewing.
Here is the step-by-step breakdown of the process:
- Dynamic Timeframe Selection: You can choose which larger timeframe you want to observe. The script identifies these periods (e.g., M1, H1, D1, etc.) and prepares the data for display.
- Data Synchronization: Because a single bar on a "Daily" chart represents many bars on a "5-minute" chart, the script performs a mathematical conversion. It calculates exactly where a specific point in time on the higher timeframe aligns with your current view.
- Historical Mapping: The tool looks back through a set number of historical bars (defined by your settings) to ensure that the trend lines you see are consistent and accurately positioned relative to the current price action.
- Dual-Line Visualization: The script generates two distinct visual indicators on your screen. These represent different data points or trend components from the selected higher timeframe, allowing you to see how the broader market structure influences your current trading environment.
Key Benefits for the User
- Contextual Awareness: It allows you to stay on a low timeframe chart (for precise entries) while simultaneously seeing the "macro" trend provided by higher timeframes.
- Seamless Integration: The script automatically adjusts its labels and naming conventions based on which timeframe you have selected, making it easy to identify which data is being displayed at a glance.
- Simplified Analysis: By plotting these external trends as lines in a separate window, it removes the guesswork of trying to mentally project how a Daily trend might affect a 15-minute trade.
Miscellaneous
10
Views
0
Downloads
0
Favorites
FTLM-STLM_MTF
//+------------------------------------------------------------------+
//|                                                    FTLM-STLM.mq4 |
//|                       Copyright © 2005, Finware Technologies Ltd |
//|                                            http://www.finware.ru |
//+------------------------------------------------------------------+
//2009mtf Copyright © 2006, Keris2112" "http://www.forex-tsd.com"

#property copyright "Copyright © 2005, Finware Technologies Ltd"
#property link      "http://www.finware.ru"

#property indicator_separate_window
#property indicator_buffers 2
#property indicator_color1 DarkKhaki
#property indicator_color2 DarkSalmon
#property indicator_width1 2
#property indicator_width2 2

//---- input parameters
extern int TimeFrame=0;
extern int       CountBars=300;
extern string  TimeFrames = "M1;5,15,30,60H1;240H4;1440D1;10080W1;43200MN|0-CurrentTF";

//---- buffers
double ExtMapBuffer1[];
double ExtMapBuffer2[];
//+------------------------------------------------------------------+
//| Custom indicator initialization function                         |
//+------------------------------------------------------------------+
int init()
  {
//---- indicators
   SetIndexStyle(0,DRAW_LINE);
   SetIndexBuffer(0,ExtMapBuffer1);
   SetIndexStyle(1,DRAW_LINE);
   SetIndexBuffer(1,ExtMapBuffer2);
//----
   TimeFrame=MathMax(TimeFrame,Period());
   switch(TimeFrame)
   {
      case 1 : string TimeFrameStr="M1"; break;
      case 5 : TimeFrameStr="M5"; break;
      case 15 : TimeFrameStr="M15"; break;
      case 30 : TimeFrameStr="M30"; break;
      case 60 : TimeFrameStr="H1"; break;
      case 240 : TimeFrameStr="H4"; break;
      case 1440 : TimeFrameStr="D1"; break;
      case 10080 : TimeFrameStr="W1"; break;
      case 43200 : TimeFrameStr="MN1"; break;
      default : TimeFrameStr="TF0";
   }
   string sname="FTLM-STLM ["+TimeFrameStr+"]";
   IndicatorShortName(sname);
   SetIndexLabel(0,sname);
   SetIndexLabel(1,sname);


   return(0);
  }
//+------------------------------------------------------------------+
//| Custor indicator deinitialization function                       |
//+------------------------------------------------------------------+
int deinit()
  {
//---- TODO: add your code here

//----
   return(0);
  }
//+------------------------------------------------------------------+
//| Custom indicator iteration function                              |
//+------------------------------------------------------------------+
int start()
  {
   datetime TimeArray[];
   int    i,limit,y=0,counted_bars=IndicatorCounted();

// Plot defined time frame on to current time frame
   ArrayCopySeries(TimeArray,MODE_TIME,Symbol(),TimeFrame);
   limit=Bars-counted_bars;
   limit=MathMax(limit,TimeFrame/Period());
   limit=MathMin(limit,CountBars);

   for(i=0,y=0;i<limit;i++)
   {
   if (TimeFrame<Period()) TimeFrame=Period();
   if (Time[i]<TimeArray[y]) y++;

     ExtMapBuffer1[i]=iCustom(NULL,TimeFrame,"FTLM-STLM",CountBars,0, y);
     ExtMapBuffer2[i]=iCustom(NULL,TimeFrame,"FTLM-STLM",CountBars,1, y);

   }

   return(0);
  }
//+------------------------------------------------------------------+
Comments