FullFiboPiv_Weekly_DK
Download script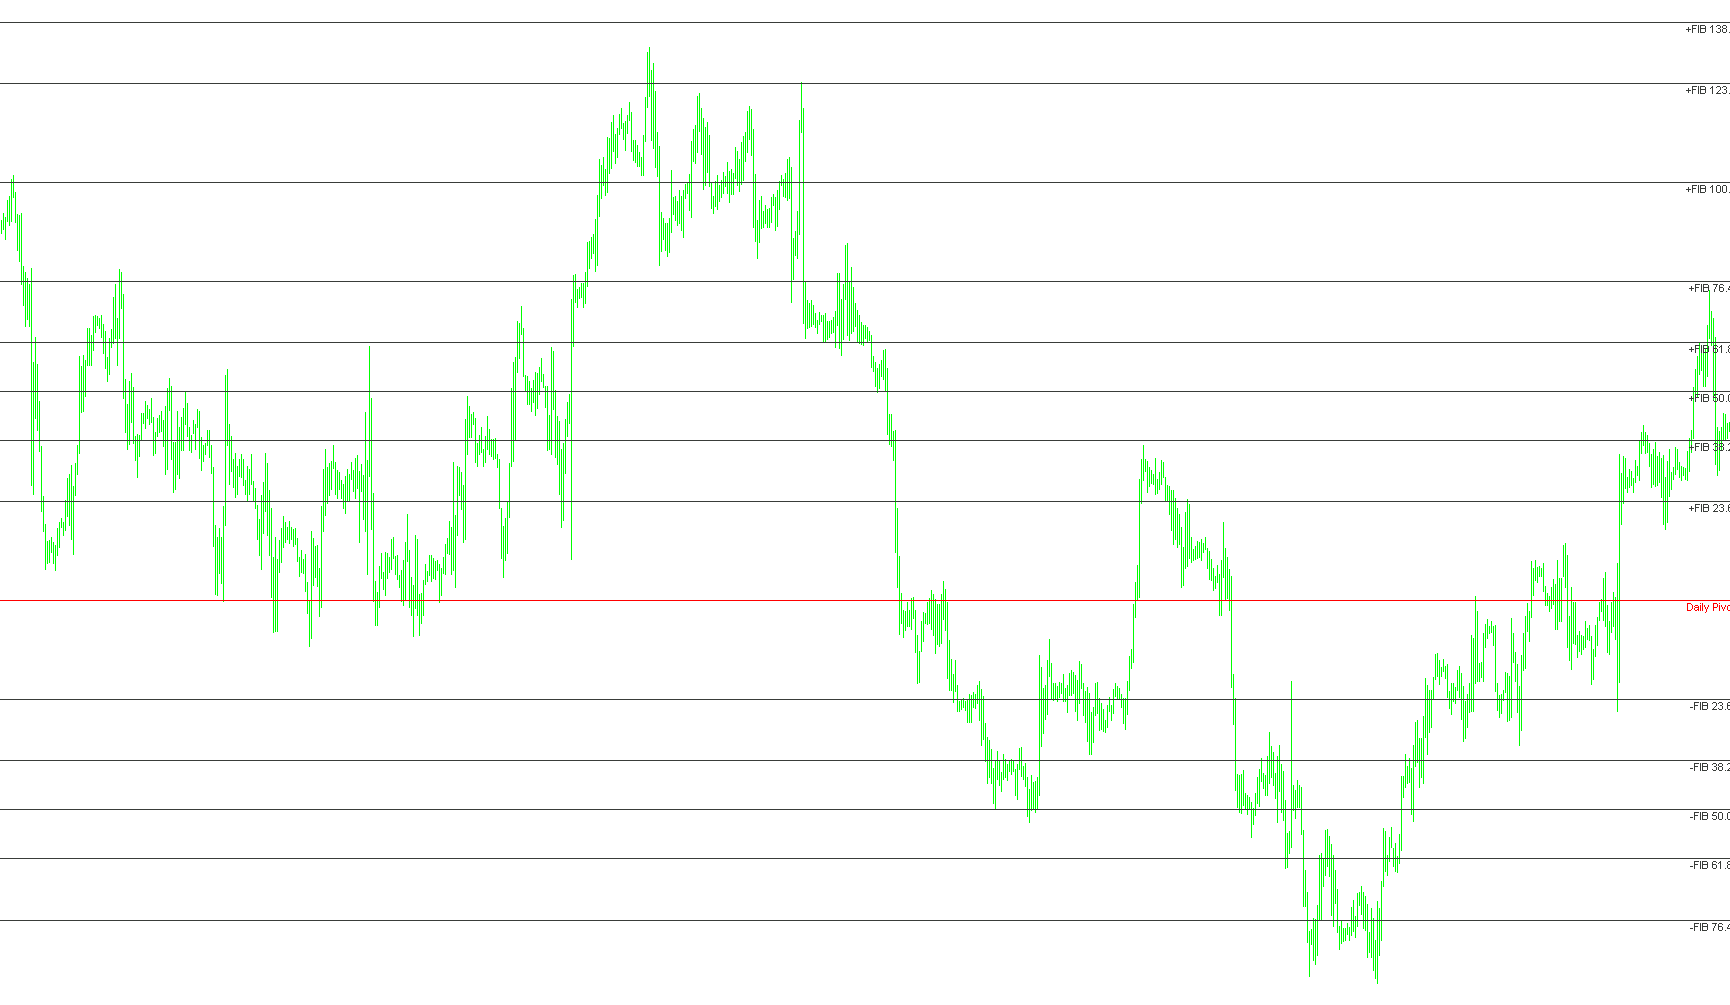
This script is a specialized financial analysis tool designed to automatically plot significant price levels on a trading chart. It combines two popular technical analysis methodologies—Pivot Points and Fibonacci Retracement levels—into a single visual layout based on weekly market data.
Core Functionality
The primary purpose of this script is to identify "zones of interest" where the price might face resistance (pressure to sell) or support (pressure to buy). Instead of requiring a user to manually calculate these numbers, the script scans the previous week's trading activity and projects those results onto the current chart.
How the Logic Works
1. Data Gathering (The Source) The script specifically looks at the weekly timeframe. It identifies three key pieces of information from the most recent completed week:
- The highest price reached (High)
- The lowest price reached (Low)
- The closing price (Close)
It includes a specific logical check for weekends; if the market is closed or transitions between weeks, it ensures it captures the correct "Friday" data to remain accurate.
2. Pivot Point Calculation Using the high, low, and close of the previous week, the script calculates a Standard Pivot Point. This is the mathematical "center" of the previous week's price action. This central line acts as the baseline for all other calculations in the script.
3. Dynamic Fibonacci Projection The script then takes the total "Range" (the difference between the high and the low) and applies a series of multiplier constants to the Pivot Point.
- Resistance Levels: It projects several levels above the pivot point. These represent potential ceilings where the price might struggle to move higher.
- Support Levels: It projects several levels below the pivot point. These represent potential floors where the price might find a base to bounce back up.
The script covers a wide spectrum of these levels, ranging from standard Fibonacci ratios (like 38.2% and 61.8%) to extended reaches (up to 200%).
4. Visual Output Once the math is complete, the script handles all the "drawing" work on your screen:
- Lines: It draws horizontal lines across the chart for every calculated level so you can see them clearly at a glance.
- Labels: It places text labels next to these lines (e.g., "+FIB 61.8" or "-FIB 100.0") so the user knows exactly which level they are looking at.
- Cleanup: To keep the chart clean, the script includes a "deinitialization" logic that automatically removes all old lines and labels when you remove the indicator, preventing "ghost" lines from cluttering your view.
Summary for the User
In short, this tool automates the heavy lifting of technical drawing. By looking at what happened last week, it provides you with a comprehensive map of "danger zones" and "opportunity zones" for the current week, allowing you to see potential price targets instantly without manual calculation.
//+------------------------------------------------------------------+
//|                                                   FullFiboPiv_Weekly_DK.mq4 |
//|                                                          Kalenzo |
//|                                      bartlomiej.gorski@gmail.com
//|                                             modified by darkkiller
//+------------------------------------------------------------------+
#property copyright "c. 2007-08, Kalenzo"
#property link      "bartlomiej.gorski@gmail.com"
#property indicator_buffers   3
#property indicator_color1 C'62,62,62'
#property indicator_style1 1
#property indicator_color2 Red
#property indicator_style1 1
#property indicator_color3 C'62,62,62'
#property indicator_style1 1


/*extern color Resistance_3 = Sienna;
extern color Resistance_2 = Red;
extern color Resistance_1 = Magenta;
extern color Pivot = Goldenrod;
extern color Support_1 = Lime;
extern color Support_2 = Green;
extern color Support_3 = DarkGreen;
*/
#property indicator_chart_window
//+------------------------------------------------------------------+
//| Custom indicator initialization function                         |
//+------------------------------------------------------------------+
int init()
  {
//---- indicators
//----
   return(0);
  }
//+------------------------------------------------------------------+
//| Custom indicator deinitialization function                       |
//+------------------------------------------------------------------+
int deinit()
  {
//----
   ObjectDelete("S1");
   ObjectDelete("S2");
   ObjectDelete("S3");
   ObjectDelete("S4");
   ObjectDelete("S5");
   ObjectDelete("S6");
   ObjectDelete("S7");
   ObjectDelete("S8");
   ObjectDelete("S9");
   ObjectDelete("S10");
   ObjectDelete("S11");
   ObjectDelete("S12");

   ObjectDelete("R1");
   ObjectDelete("R2");
   ObjectDelete("R3");
   ObjectDelete("R4");
   ObjectDelete("R5");
   ObjectDelete("R6");
   ObjectDelete("R7");
   ObjectDelete("R8");
   ObjectDelete("R9");
   ObjectDelete("R10");
   ObjectDelete("R11");
   ObjectDelete("R12");

   ObjectDelete("PIVOT");
   ObjectDelete("Daily Pivot");

   ObjectDelete("-FIB 23.6");
   ObjectDelete("-FIB 38.2");
   ObjectDelete("-FIB 50.0");
   ObjectDelete("-FIB 61.8");
   ObjectDelete("-FIB 76.4");
   ObjectDelete("-FIB 100.0");
   ObjectDelete("-FIB 123.6");
   ObjectDelete("-FIB 138.2");
   ObjectDelete("-FIB 150.0");
   ObjectDelete("-FIB 161.8");
   ObjectDelete("-FIB 176.4");
   ObjectDelete("-FIB 200.0");

   ObjectDelete("+FIB 23.6");
   ObjectDelete("+FIB 38.2");
   ObjectDelete("+FIB 50.0");
   ObjectDelete("+FIB 61.8");
   ObjectDelete("+FIB 76.4");
   ObjectDelete("+FIB 100.0");
   ObjectDelete("+FIB 123.6");
   ObjectDelete("+FIB 138.2");
   ObjectDelete("+FIB 150.0");
   ObjectDelete("+FIB 161.8");
   ObjectDelete("+FIB 176.4");
   ObjectDelete("+FIB 200.0");
   Comment(" ");
//----
   return(0);
  }
//+------------------------------------------------------------------+
//| Custom indicator iteration function                              |
//+------------------------------------------------------------------+
int start()
  {

//----
double rates[1][6],yesterday_close,yesterday_high,yesterday_low;
ArrayCopyRates(rates, Symbol(), PERIOD_W1);

if(DayOfWeek() == 1)
{
   if(TimeDayOfWeek(iTime(Symbol(),PERIOD_W1,1)) == 5)
   {
       yesterday_close = rates[1][4];
       yesterday_high = rates[1][3];
       yesterday_low = rates[1][2];
   }
   else
   {
      for(int d = 5;d>=0;d--)
      {
         if(TimeDayOfWeek(iTime(Symbol(),PERIOD_W1,d)) == 5)
         {
             yesterday_close = rates[d][4];
             yesterday_high = rates[d][3];
             yesterday_low = rates[d][2];
         }

      }

   }
}
else
{
    yesterday_close = rates[1][4];
    yesterday_high = rates[1][3];
    yesterday_low = rates[1][2];
}


//---- Calculate Pivots

Comment("");
double R = yesterday_high - yesterday_low;//range
double p = (yesterday_high + yesterday_low + yesterday_close)/3;// Standard Pivot

double r12 = p + (R * 2.000);
double r11 = p + (R * 1.764);
double r10 = p + (R * 1.618);
double r9 = p + (R * 1.500);
double r8 = p + (R * 1.382);
double r7 = p + (R * 1.236);
double r6 = p + (R * 1.000);
double r5 = p + (R * 0.764);
double r4 = p + (R * 0.618);
double r3 = p + (R * 0.500);
double r2 = p + (R * 0.382);
double r1 = p + (R * 0.236);
double s1 = p - (R * 0.236);
double s2 = p - (R * 0.382);
double s3 = p - (R * 0.500);
double s4 = p - (R * 0.618);
double s5 = p - (R * 0.764);
double s6 = p - (R * 1.000);
double s7 = p - (R * 1.236);
double s8 = p - (R * 1.382);
double s9 = p - (R * 1.500);
double s10 = p - (R * 1.618);
double s11 = p - (R * 1.764);
double s12 = p - (R * 2.000);

drawLine(r12,"R12", indicator_color1,indicator_style1);
drawLabel("+FIB 200.0",r12,indicator_color1);
drawLine(r11,"R11", indicator_color1,indicator_style1);
drawLabel("+FIB 176.4",r11,indicator_color1);
drawLine(r10,"R10", indicator_color1,indicator_style1);
drawLabel("+FIB 161.8",r10,indicator_color1);
drawLine(r9,"R9", indicator_color1,indicator_style1);
drawLabel("+FIB 150.0",r9,indicator_color1);
drawLine(r8,"R8", indicator_color1,indicator_style1);
drawLabel("+FIB 138.2",r8,indicator_color1);
drawLine(r7,"R7", indicator_color1,indicator_style1);
drawLabel("+FIB 123.6",r7,indicator_color1);
drawLine(r6,"R6", indicator_color1,indicator_style1);
drawLabel("+FIB 100.0",r6,indicator_color1);
drawLine(r5,"R5", indicator_color1,indicator_style1);
drawLabel("+FIB 76.4",r5,indicator_color1);
drawLine(r4,"R4", indicator_color1,indicator_style1);
drawLabel("+FIB 61.8",r4,indicator_color1);
drawLine(r3,"R3", indicator_color1,indicator_style1);
drawLabel("+FIB 50.0",r3,indicator_color1);
drawLine(r2,"R2", indicator_color1,indicator_style1);
drawLabel("+FIB 38.2",r2,indicator_color1);
drawLine(r1,"R1", indicator_color1,indicator_style1);
drawLabel("+FIB 23.6",r1,indicator_color1);

drawLine(p,"PIVOT",indicator_color2,indicator_style1);
drawLabel("Daily Pivot",p,indicator_color2);

drawLine(s1,"S1",indicator_color3,indicator_style1);
drawLabel("-FIB 23.6",s1,indicator_color3);
drawLine(s2,"S2",indicator_color3,indicator_style1);
drawLabel("-FIB 38.2",s2,indicator_color3);
drawLine(s3,"S3",indicator_color3,indicator_style1);
drawLabel("-FIB 50.0",s3,indicator_color3);
drawLine(s4,"S4",indicator_color3,indicator_style1);
drawLabel("-FIB 61.8",s4,indicator_color3);
drawLine(s5,"S5",indicator_color3,indicator_style1);
drawLabel("-FIB 76.4",s5,indicator_color3);
drawLine(s6,"S6",indicator_color3,indicator_style1);
drawLabel("-FIB 100.0",s6,indicator_color3);
drawLine(s7,"S7",indicator_color3,indicator_style1);
drawLabel("-FIB 123.6",s7,indicator_color3);
drawLine(s8,"S8",indicator_color3,indicator_style1);
drawLabel("-FIB 138.2",s8,indicator_color3);
drawLine(s9,"S9",indicator_color3,indicator_style1);
drawLabel("-FIB 150.0",s9,indicator_color3);
drawLine(s10,"S10",indicator_color3,indicator_style1);
drawLabel("-FIB 161.8",s10,indicator_color3);
drawLine(s11,"S11",indicator_color3,indicator_style1);
drawLabel("-FIB 176.4",s11,indicator_color3);
drawLine(s12,"S12",indicator_color3,indicator_style1);
drawLabel("-FIB 200.0",s12,indicator_color3);

//----
   return(0);
  }
//+------------------------------------------------------------------+
void drawLabel(string name,double lvl,color Color)
{
    if(ObjectFind(name) != 0)
    {
        ObjectCreate(name, OBJ_TEXT, 0, Time[10], lvl);
        ObjectSetText(name, name, 8, "Arial", EMPTY);
        ObjectSet(name, OBJPROP_COLOR, Color);
    }
    else
    {
        ObjectMove(name, 0, Time[10], lvl);
    }
}


void drawLine(double lvl,string name, color Col,int type)
{
         if(ObjectFind(name) != 0)
         {
            ObjectCreate(name, OBJ_HLINE, 0, Time[0], lvl,Time[0],lvl);

            if(type == 1)
            ObjectSet(name, OBJPROP_STYLE, STYLE_SOLID);
            else if(type == 2)
            ObjectSet(name, OBJPROP_STYLE, STYLE_DASHDOTDOT);
            else
            ObjectSet(name, OBJPROP_STYLE, STYLE_DOT);

            ObjectSet(name, OBJPROP_COLOR, Col);
            ObjectSet(name,OBJPROP_WIDTH,1);

         }
         else
         {
            ObjectDelete(name);
            ObjectCreate(name, OBJ_HLINE, 0, Time[0], lvl,Time[0],lvl);

            if(type == 1)
            ObjectSet(name, OBJPROP_STYLE, STYLE_SOLID);
            else if(type == 2)
            ObjectSet(name, OBJPROP_STYLE, STYLE_DASHDOTDOT);
            else
            ObjectSet(name, OBJPROP_STYLE, STYLE_DOT);

            ObjectSet(name, OBJPROP_COLOR, Col);
            ObjectSet(name,OBJPROP_WIDTH,1);

         }
}
Comments