Filter overRSI
Download script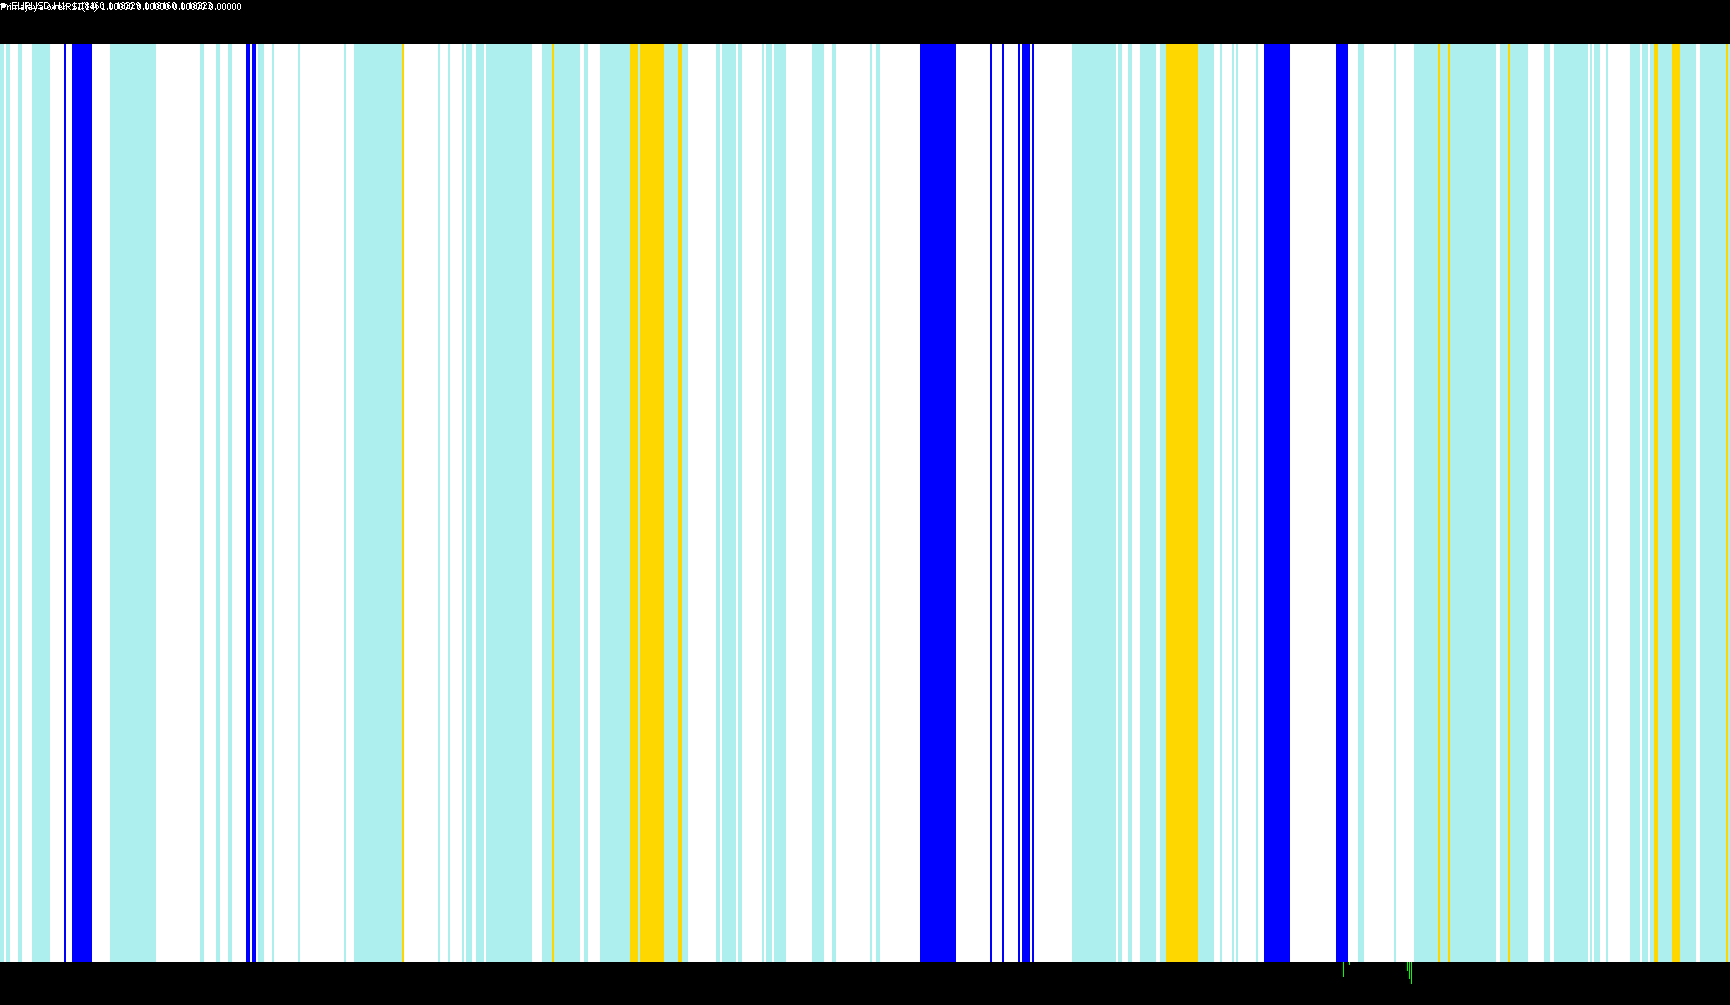
This technical indicator is designed to help traders visualize market momentum and identify specific trend states by analyzing the Relative Strength Index (RSI). Instead of showing a simple line, it categorizes price action into four distinct visual zones to help users distinguish between "active trends" and "extreme market conditions."
Core Logic Overview
The script operates by monitoring the RSI value—a standard momentum oscillator—and dividing the market behavior into four specific categories based on numerical thresholds:
- Strong Bullish Momentum (Overbought): When the RSI reaches high levels, the indicator identifies an area of extreme strength or potential overbuying.
- Bullish Trend: When the RSI is in a positive but moderate range, the indicator recognizes a steady upward trend.
- Bearish Trend: When the RSI is in a negative but moderate range, the indicator recognizes a steady downward trend.
- Strong Bearish Momentum (Oversold): When the RSI reaches low levels, the indicator identifies an area of extreme weakness or potential overselling.
Visual Representation
The script translates these four logic states into a multi-layered histogram display. By using different colors and intensities, it allows a trader to see at a glance whether the market is currently:
- Moving in a standard trend (steady growth or decline).
- Pushing into extreme territory (potential exhaustion or very strong momentum).
How it works for the user
Rather than requiring you to manually interpret complex RSI numbers, this tool automates that analysis. It constantly scans historical and real-time price data, calculates the momentum, and "filters" it into visual signals. This helps in identifying when a trend is healthy versus when it might be reaching a climax, providing a clearer picture of the market's directionality.
//+------------------------------------------------------------------+
//|                                               Filter overWPR.mq4 |
//|                   Copyright © 2006, Indoforex Groups - Primajaya |
//|                                   http://primaforex.blogspot.com |
//+------------------------------------------------------------------+
#property copyright "Copyright © 2006, Indoforex Groups"
#property link      "http://primaforex.blogspot.com"

#property indicator_separate_window
#property indicator_minimum -0.05
#property indicator_maximum 1.00
#property indicator_buffers 4
#property indicator_color1 Blue
#property indicator_color2 Red
#property indicator_color3 SteelBlue
#property indicator_color4 Orange


//---- input parameters
extern int PeriodeRSI=14;
//---- indicator buffers
double UpBuffer1[];
double DnBuffer1[];
double UpBuffer2[];
double DnBuffer2[];
//+------------------------------------------------------------------+
//| Custom indicator initialization function                         |
//+------------------------------------------------------------------+
  int init()
  {
   string short_name;
//---- indicator line
   SetIndexStyle(0,DRAW_HISTOGRAM,STYLE_SOLID,2);
   SetIndexStyle(1,DRAW_HISTOGRAM,STYLE_SOLID,2);
   SetIndexStyle(2,DRAW_HISTOGRAM,STYLE_SOLID,2);
   SetIndexStyle(3,DRAW_HISTOGRAM,STYLE_SOLID,2);

   SetIndexBuffer(0,UpBuffer1);
   SetIndexBuffer(1,DnBuffer1);
   SetIndexBuffer(2,UpBuffer2);
   SetIndexBuffer(3,DnBuffer2);

   IndicatorDigits(MarketInfo(Symbol(),MODE_DIGITS));
//---- name for DataWindow and indicator subwindow label
   short_name="Primajaya overRSI("+PeriodeRSI+")";
   IndicatorShortName(short_name);
   SetIndexLabel(0,"Overbought or Strong Bulls");
   SetIndexLabel(1,"Oversold or Strong Bears");
   SetIndexLabel(2,"Trend Bulls");
   SetIndexLabel(3,"Trend Bears");

//----
   SetIndexDrawBegin(0,PeriodeRSI);
   SetIndexDrawBegin(1,PeriodeRSI);
   SetIndexDrawBegin(2,PeriodeRSI);
   SetIndexDrawBegin(3,PeriodeRSI);
//----
   return(0);
  }

//+------------------------------------------------------------------+
//| ProSol Confirmation                                              |
//+------------------------------------------------------------------+
int start()
  {
   int shift,trend;
   double RSI0;


   for(shift=Bars-PeriodeRSI-1;shift>=0;shift--)
   {
   RSI0=iRSI(NULL,0,PeriodeRSI,PRICE_CLOSE,shift);

	  if (RSI0>50 && RSI0<68)  trend=1;
	  if (RSI0>=68)  trend=2;
	  if (RSI0<=50 && RSI0>32) trend=-1;
	  if (RSI0<32)  trend=-2;

	  if (trend==1)
	  {

	  UpBuffer1[shift]=0;
	  UpBuffer2[shift]=1;
	  DnBuffer1[shift]=0;
	  DnBuffer2[shift]=0;

	  }
	  if (trend==2)
	  {

	  UpBuffer1[shift]=1;
	  UpBuffer2[shift]=0;
	  DnBuffer1[shift]=0;
	  DnBuffer2[shift]=0;

	  }
	  if (trend==-1)
	  {

	  UpBuffer1[shift]=0;
	  UpBuffer2[shift]=0;
	  DnBuffer1[shift]=0;
	  DnBuffer2[shift]=1;
	  }

	  if (trend==-2)
	  {

	  UpBuffer1[shift]=0;
	  UpBuffer2[shift]=0;
	  DnBuffer1[shift]=1;
	  DnBuffer2[shift]=0;

	  }
	}
	return(0);
 }
Comments