Fisher_m11_v1
Download script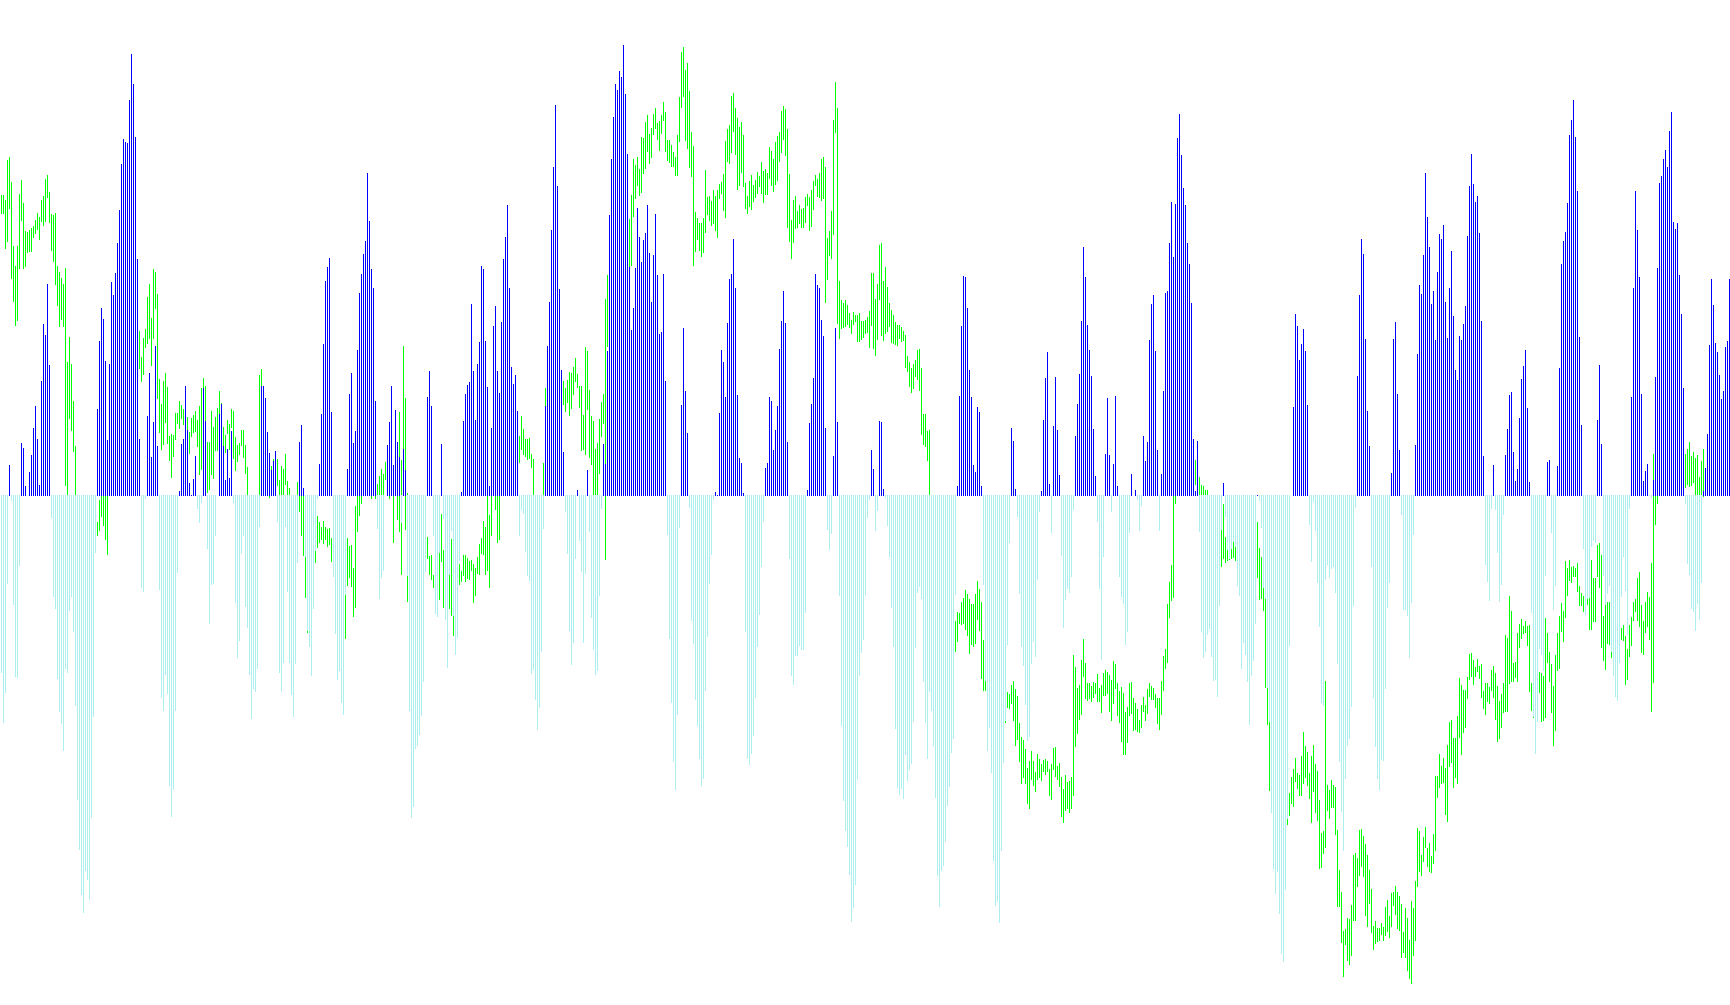
Technical Overview: Fisher_m11 Indicator Logic
The Fisher_m11 is a custom technical analysis tool designed to identify and visualize market trends by analyzing price action relative to its recent historical range. Unlike standard oscillators that focus purely on momentum, this script calculates the "relative location" of the current price within a specific window of time to determine if the market is leaning toward an upward or downward bias.
Core Methodology
The logic operates through a multi-stage calculation process designed to smooth out market noise and highlight significant directional shifts:
1. Range Analysis The indicator begins by scanning a defined period of recent price bars (the RangePeriods). It identifies the highest peak and the lowest valley within this timeframe. By establishing this "Greatest Range," the script creates a boundary for the current price movement.
2. Relative Positioning Instead of looking at the absolute price, the tool calculates where the current price sits between that high and low point. This is converted into a normalized value:
- A price near the top of the range yields a positive value.
- A price near the bottom yields a negative value.
- A price in the middle remains neutral.
3. Dual-Layer Smoothing To prevent the indicator from reacting too sharply to minor, erratic price spikes (noise), the script applies two distinct layers of smoothing:
- Price Smoothing: This stabilizes the relative position of the price, ensuring that the transition between "high" and "low" areas is fluid rather than jagged.
- Index Smoothing: Once the position is stabilized, the script calculates a logarithmic value (the Fisher Index). This final calculation is smoothed again to produce a clear, readable trend line.
4. Visual Trend Representation The final output is presented in a separate window as a histogram. The logic categorizes the results into two distinct visual signals:
- Upward Trend: When the calculated index value is positive, the indicator displays a green (Lime) histogram.
- Downward Trend: When the calculated index value falls below zero, the indicator displays a red histogram.
Summary for Traders
The Fisher_m11 serves as a trend-following visual aid. By normalizing price movement into a relative scale and applying consecutive smoothing filters, it attempts to filter out "market jitter" to provide a clearer picture of whether the current momentum is leaning bullish or bearish based on its position within the recent trading range.
//+------------------------------------------------------------------+
//|                                                   Fisher_m11.mq4 |
//|                                   Copyright © 23.07.2006 MartinG |
//|                                http://home.arcor.de/cam06/fisher |
//+------------------------------------------------------------------+
#property copyright "Copyright © 23.07.2006 MartinG"
#property link      "http://home.arcor.de/cam06/fisher"
//----
#property indicator_separate_window
//#property indicator_minimum -1
//#property indicator_maximum 1
#property indicator_buffers 3
#property indicator_color2 Lime
#property indicator_color3 Red
#property indicator_width2 4
#property indicator_width3 4
//----
int   LeftNum1=56;
int   LeftNum2=56;
//----
extern int     RangePeriods=10;
extern double  PriceSmoothing=0.3;    // =0.67 bei Fisher_m10
extern double  IndexSmoothing=0.3;    // =0.50 bei Fisher_m10
string         ThisName="Fisher_m11";
int            DrawStart;
//---- buffers
double ExtMapBuffer1[];
double ExtMapBuffer2[];
double ExtMapBuffer3[];
double ExtMapBuffer4[];
//+------------------------------------------------------------------+
//| Custom indicator initialization function                         |
//+------------------------------------------------------------------+
int init()
  {
//---- indicators
   IndicatorBuffers(4);
   SetIndexLabel(0,"Fish");
   SetIndexStyle(0,DRAW_NONE);
   SetIndexBuffer(0,ExtMapBuffer1);
   SetIndexStyle(1,DRAW_HISTOGRAM);
   SetIndexBuffer(1,ExtMapBuffer2);
   SetIndexStyle(2,DRAW_HISTOGRAM);
   SetIndexBuffer(2,ExtMapBuffer3);
   SetIndexStyle(3,DRAW_NONE);
   SetIndexBuffer(3,ExtMapBuffer4);
//----
   string Text=ThisName;
   Text=Text+"  (rPeriods "+RangePeriods;
   Text=Text+", pSmooth "+DoubleToStr(PriceSmoothing,2);
   Text=Text+", iSmooth "+DoubleToStr(IndexSmoothing,2);
   Text=Text+")  ";
   IndicatorShortName(Text);
   SetIndexLabel(1,NULL);
   SetIndexLabel(2,NULL);
   DrawStart=2*RangePeriods+4;             // DrawStart= BarNumber calculated from left to right
   SetIndexDrawBegin(1,DrawStart);
   SetIndexDrawBegin(2,DrawStart);
//----
   if (PriceSmoothing>=1.0)
     {
      PriceSmoothing=0.9999;
      Alert("Fish61: PriceSmothing factor has to be smaller 1!");
     }
   if (PriceSmoothing<0)
     {
      PriceSmoothing=0;
      Alert("Fish61: PriceSmothing factor mustn''t be negative!");
     }
   if (IndexSmoothing>=1.0)
     {
      IndexSmoothing=0.9999;
      Alert("Fish61: PriceSmothing factor has to be smaller 1!");
     }
   if (IndexSmoothing<0)
     {
      IndexSmoothing=0;
      Alert("Fish61: PriceSmothing factor mustn''t be negative!");
     }
//----
   return(0);
  }
//+------------------------------------------------------------------+
//| Custom indicator deinitialization function                       |
//+------------------------------------------------------------------+
int deinit()
  {
//----
//----
   return(0);
  }
//+------------------------------------------------------------------+
//| Custom indicator iteration function                              |
//+------------------------------------------------------------------+
int start()
  {
   if (Bars<DrawStart)
     {
      Alert("Fish84: Not enough Bars loaded to calculate FisherIndicator with RangePeriods=",RangePeriods);
      return(-1);
     }
//----
   int    counted_bars=IndicatorCounted();
   if (counted_bars<0) return(-1);
   if (counted_bars>0) counted_bars--;
//----
   int Position=Bars-counted_bars;        // Position = BarPosition calculated from right to left
   int LeftNum1=Bars-Position;            // when more bars are loaded the Position of a bar changes but not its LeftNum
   if (LeftNum1<RangePeriods+1)Position=Bars-RangePeriods-1;
//----
   while(Position>=0)
     {
      CalculateCurrentBar(Position);
      Position--;
     }
//----
   return(0);
  }
//+------------------------------------------------------------------+
//| Single Bar Calculation function                                  |
//+------------------------------------------------------------------+
int CalculateCurrentBar(int pos)
  {
   double  LowestLow, HighestHigh, GreatestRange, MidPrice;
   double  PriceLocation, SmoothedLocation, FishIndex, SmoothedFish;
//----
   LowestLow=Low[Lowest(NULL,0,MODE_LOW,RangePeriods,pos)];
   HighestHigh=High[Highest(NULL,0,MODE_HIGH,RangePeriods,pos)];
   if (HighestHigh-LowestLow<0.1*Point)HighestHigh=LowestLow+0.1*Point;
   GreatestRange=HighestHigh-LowestLow;
   MidPrice=(High[pos]+Low[pos])/2;
   // PriceLocation in current Range
   if (GreatestRange!=0)
     {
      PriceLocation=(MidPrice-LowestLow)/GreatestRange;
      PriceLocation= 2.0*PriceLocation - 1.0;           // ->  -1 < PriceLocation < +1
     }
   // Smoothing of PriceLocation
   ExtMapBuffer4[pos]=PriceSmoothing*ExtMapBuffer4[pos+1]+(1.0-PriceSmoothing)*PriceLocation;
   SmoothedLocation=ExtMapBuffer4[pos];
   if (SmoothedLocation> 0.99) SmoothedLocation= 0.99; // verhindert, dass MathLog unendlich wird
   if (SmoothedLocation<-0.99) SmoothedLocation=-0.99; // verhindert, dass MathLog minuns unendlich wird
   // FisherIndex
   if(1-SmoothedLocation!=0) FishIndex=MathLog((1+SmoothedLocation)/(1-SmoothedLocation));
   else Alert("Fisher129: Unerlaubter Zustand bei Bar Nummer ",Bars-pos);
   // Smoothing of FisherIndex
   ExtMapBuffer1[pos]=IndexSmoothing*ExtMapBuffer1[pos+1]+(1.0-IndexSmoothing)*FishIndex;
   if (Bars-pos<DrawStart)ExtMapBuffer1[pos]=0;
   SmoothedFish=ExtMapBuffer1[pos];
//----
   if (SmoothedFish>0)     // up trend
     {
      ExtMapBuffer2[pos]=SmoothedFish;
      ExtMapBuffer3[pos]=0;
     }
   else                          // else down trend
     {
      ExtMapBuffer2[pos]=0;
      ExtMapBuffer3[pos]=SmoothedFish;
     }
//----
   return(0);
  }
//+------------------------------------------------------------------+
Comments