Find Data Holes
Download script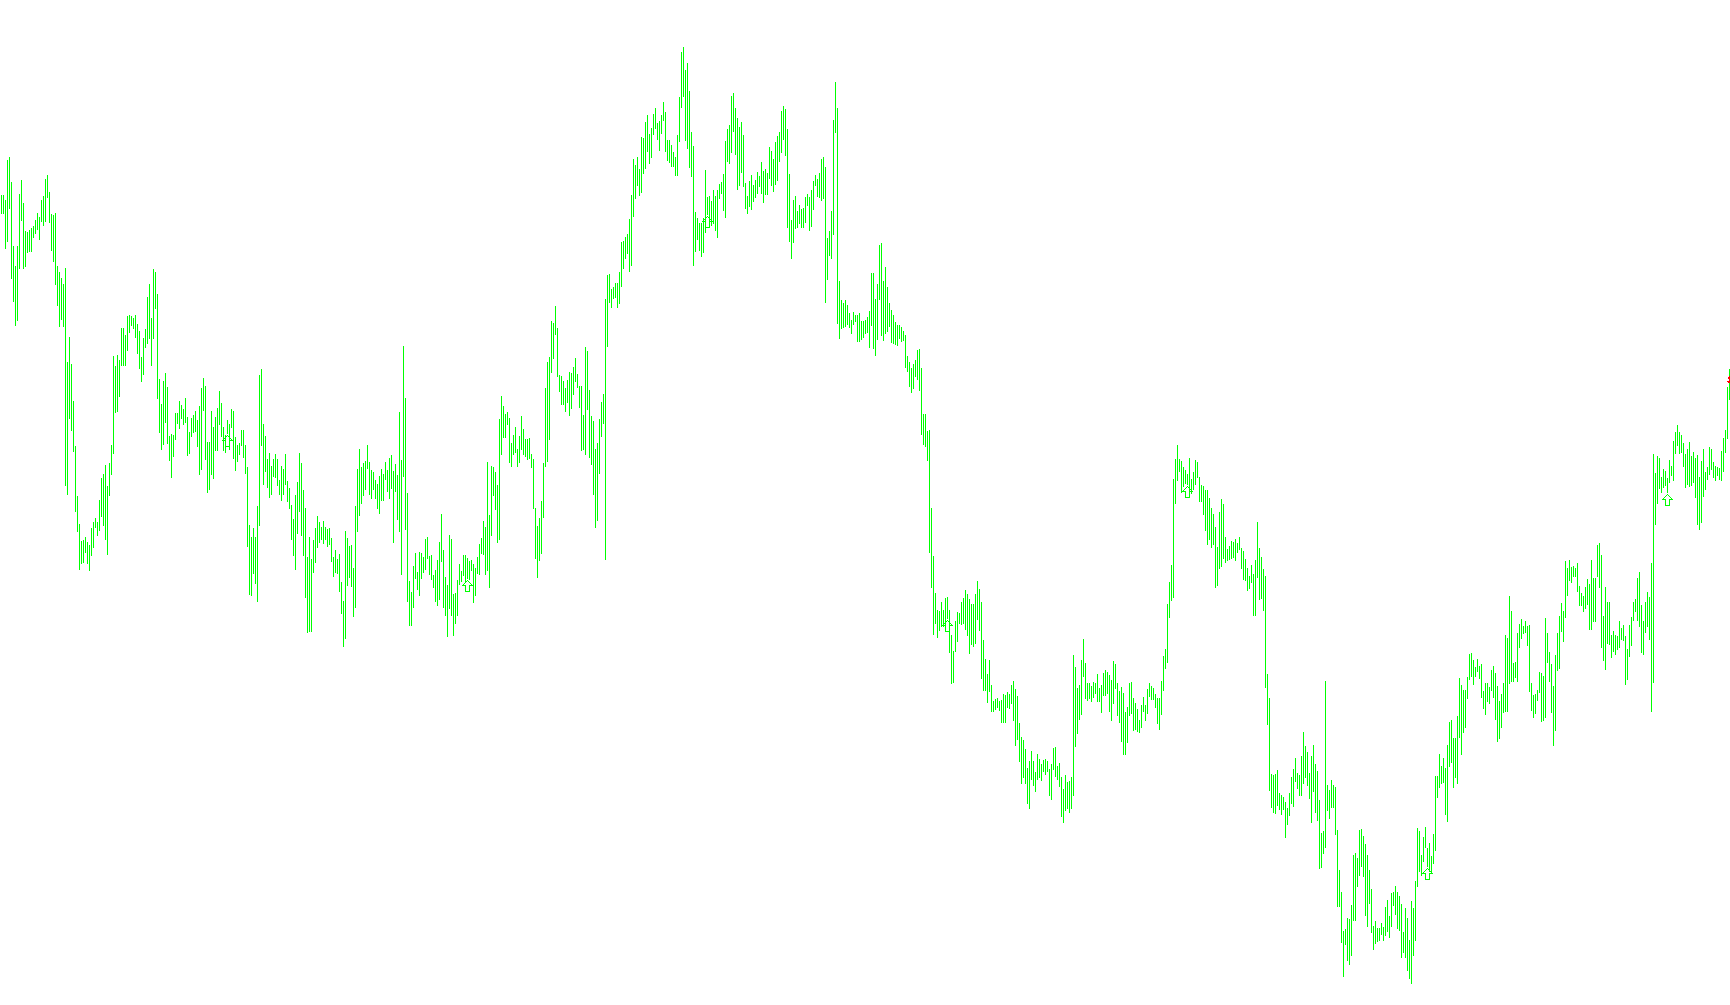
This script is designed to audit your trading charts to identify "data holes"—periods where price information is missing or disconnected. In automated trading, gaps in history can sometimes cause issues with analysis, so this tool helps you visualize exactly where those gaps occur.
How the Logic Works
The script performs a systematic review of your entire chart history, looking at every historical candle one by one to check for chronological consistency. Here is the step-by-step breakdown of its process:
1. Detecting Time Gaps The tool calculates the time difference between consecutive bars on your chart. It compares this duration against the expected length of a bar based on your current timeframe. If the jump in time between two bars exceeds a specific threshold (calculated as slightly more than two standard bars), the script flags that area as a potential gap.
2. Categorizing the Gaps Not all gaps are equal, so the script distinguishes between two types of missing data:
- Weekend Gaps: If the script detects a jump that occurs specifically between a Friday and a Monday, it recognizes this as a standard market weekend closure. It marks these with a lime-colored arrow to let you know the gap is intentional because the markets were closed.
- Data Holes: If the script finds a significant time jump that isn't a weekend (for example, a missing day during the middle of a week), it identifies this as a "Data Hole." This usually indicates a period where data was not recorded, your internet connection was lost, or the broker's history is incomplete.
3. Visualizing and Reporting For every "Data Hole" found, the script places a specific symbol on your chart at the exact point where the jump occurred. This allows you to scroll back through your history and see exactly where the data stream was interrupted.
4. Final Summary Once the scan is complete, the tool provides a final alert notification. It summarizes the total number of data holes found so you can quickly assess how reliable or continuous your current chart data is.
//+------------------------------------------------------------------+
//|                                              Find Data Holes.mq4 |
//|                         Copyright © 2005, Luis Guilherme Damiani |
//|                                      http://www.damianifx.com.br |
//+------------------------------------------------------------------+
#property copyright "Copyright © 2005, Luis Guilherme Damiani"
#property link      "http://www.damianifx.com.br"
int hole_count=0;
int hole_size=2;
//+------------------------------------------------------------------+
//| script program start function                                    |
//+------------------------------------------------------------------+
int start()
  {

//----
   for(int i=0;i<Bars;i++)
   {
      if (iTime(NULL,0,i)-iTime(NULL,0,i+1)>Period()*hole_size*60+30)
      {
         if(TimeDayOfWeek(iTime(NULL,0,i+1))==5 && TimeDayOfWeek(iTime(NULL,0,i))== 1)
         {
               ObjectCreate("Weekend"+i,OBJ_ARROW,0,Time[i], Low[i]);
               ObjectSet("Weekend"+i,OBJPROP_COLOR,Lime);
         }
         else
         {
            ObjectCreate("Hole"+i,OBJ_ARROW,0,Time[i], Low[i]);
            ObjectSet("Hole"+i,OBJPROP_ARROWCODE,251);
            hole_count=hole_count+1;
         }
      }
   }
   Alert(hole_count+"  holes were found, of size: "+hole_size+" bars.");
//----
   return(0);
  }
//+------------------------------------------------------------------+
Comments