Fisher_m11_v2
Download script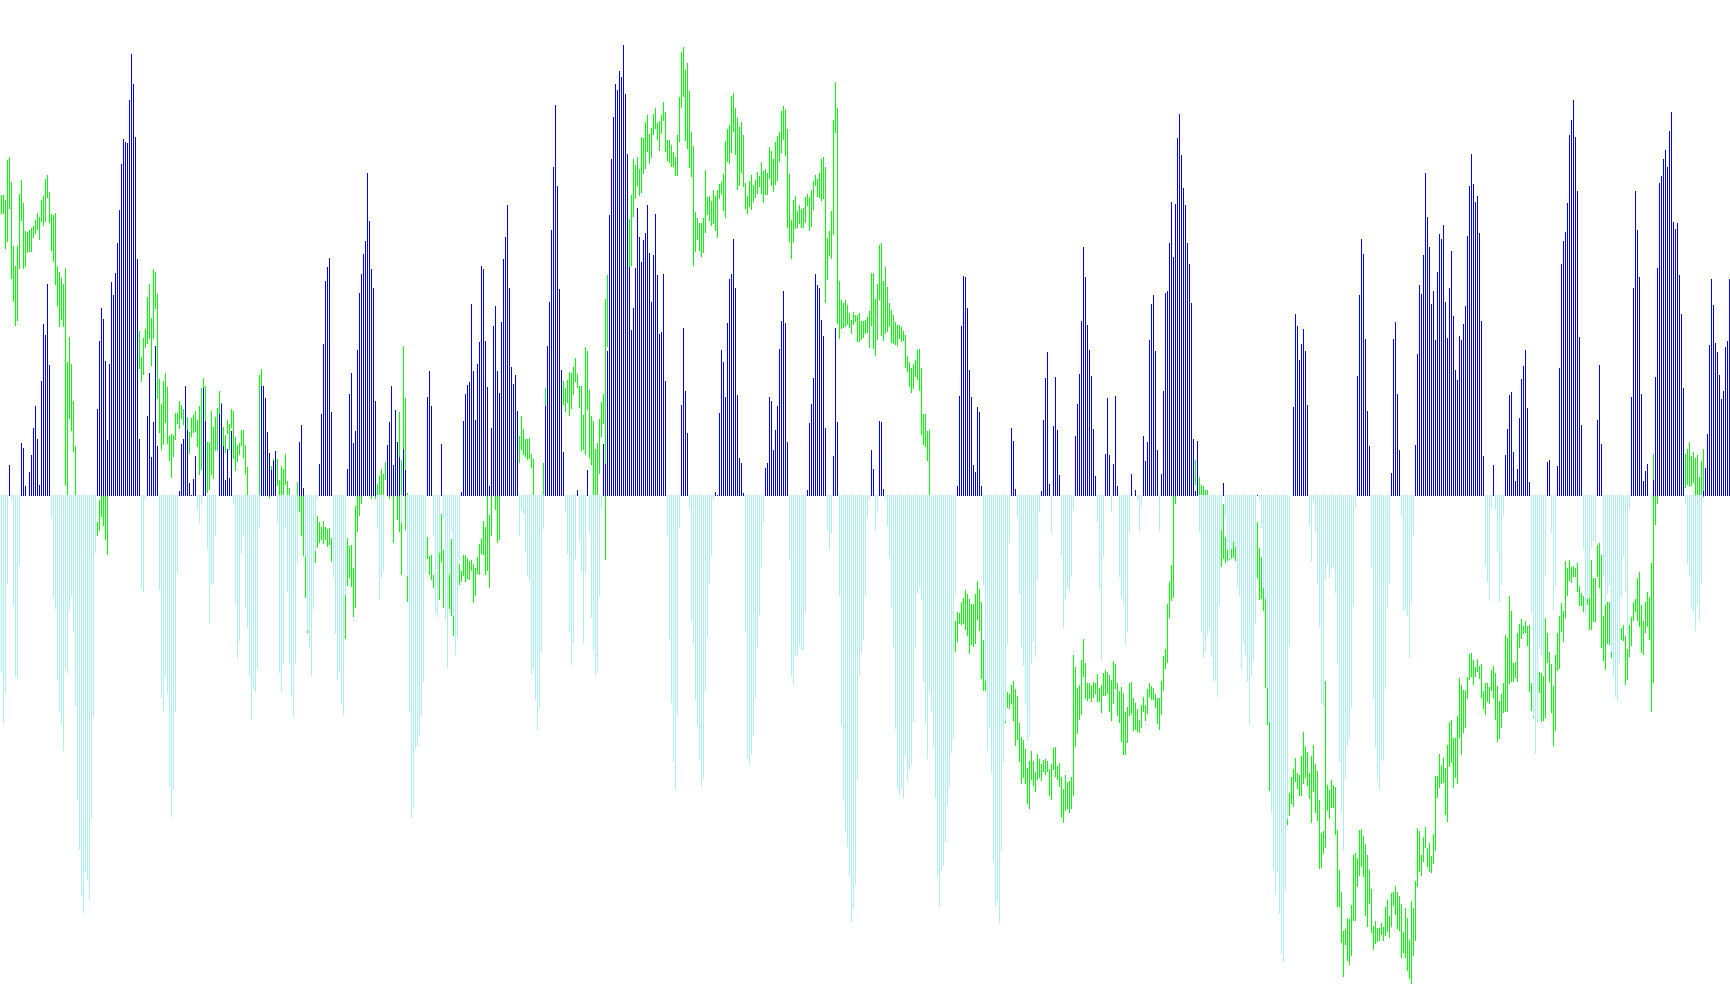
The Fisher_m11 indicator is a technical analysis tool designed to help traders identify the prevailing trend of the market by analyzing price movement and momentum. Rather than simply looking at the raw price of an asset, this script transforms price data into a smoothed visual representation that highlights whether the market is moving upward or downward.
Core Logic and Mechanism
The indicator operates through a multi-step mathematical process to filter out "market noise" and focus on the underlying direction of price action:
1. Range Analysis The script first looks at a specific number of recent bars (defined by the "Range Periods"). It identifies the highest high and the lowest low within that timeframe. This allows the indicator to understand the current boundaries of the market's movement.
2. Price Positioning Once the high and low points are identified, the script determines where the current price sits relative to those boundaries. It calculates a "Price Location" score.
- If the price is near the top of the range, it receives a positive value.
- If the price is near the bottom of the range, it receives a negative value.
3. Dual-Layer Smoothing To prevent the indicator from jumping erratically with every small price flicker, the script applies two distinct layers of smoothing:
- Price Smoothing: It takes the calculated location and blends it with the previous bar's data. This ensures that sudden spikes do not cause extreme shifts in the visual output.
- Index Smoothing: After calculating the core "Fisher Index" (a logarithmic calculation used to amplify the difference between trend directions), the script smooths the result once more. This creates a fluid, steady line or histogram.
4. Trend Visualization The final output is displayed in a separate window below the main price chart as a histogram:
- Upward Trend: When the smoothed calculation results in a positive value, the indicator displays a Lime-colored bar, signaling bullish momentum.
- Downward Trend: When the result is negative, it displays a Red-colored bar, signaling bearish momentum.
Summary for Traders
The primary goal of this logic is to provide a clear, visual "pulse" of the market. By smoothing the price location and applying a logarithmic transform, the Fisher_m11 helps traders distinguish between temporary fluctuations and sustained trends, making it easier to see when the market's momentum is shifting from one direction to another.
/*-----------------------------+
|			       |
| Shared by www.Aptrafx.com    |
|			       |
+------------------------------*/

//+------------------------------------------------------------------+
//|                                                   Fisher_m11.mq4 |
//|                                   Copyright © 23.07.2006 MartinG |
//|                                http://home.arcor.de/cam06/fisher |
//+------------------------------------------------------------------+
#property copyright "Copyright © 23.07.2006 MartinG"
#property link      "http://home.arcor.de/cam06/fisher"

#property indicator_separate_window
//#property indicator_minimum -1
//#property indicator_maximum 1
#property indicator_buffers 3
#property indicator_color2 Lime
#property indicator_color3 Red
#property indicator_width2 4
#property indicator_width3 4

int   LeftNum1=56;
int   LeftNum2=56;

extern int     RangePeriods=10;
extern double  PriceSmoothing=0.3;    // =0.67 bei Fisher_m10
extern double  IndexSmoothing=0.3;    // =0.50 bei Fisher_m10

string         ThisName="Fisher_m11";
int            DrawStart;

//---- buffers
double ExtMapBuffer1[];
double ExtMapBuffer2[];
double ExtMapBuffer3[];
double ExtMapBuffer4[];
//+------------------------------------------------------------------+
//| Custom indicator initialization function                         |
//+------------------------------------------------------------------+
int init()
  {
//---- indicators
   IndicatorBuffers(4);

   SetIndexLabel(0,"Fish");
   SetIndexStyle(0,DRAW_NONE);
   SetIndexBuffer(0,ExtMapBuffer1);
   SetIndexStyle(1,DRAW_HISTOGRAM);
   SetIndexBuffer(1,ExtMapBuffer2);
   SetIndexStyle(2,DRAW_HISTOGRAM);
   SetIndexBuffer(2,ExtMapBuffer3);
   SetIndexStyle(3,DRAW_NONE);
   SetIndexBuffer(3,ExtMapBuffer4);

   string Text=ThisName;
   Text=Text+"  (rPeriods "+RangePeriods;
   Text=Text+", pSmooth "+DoubleToStr(PriceSmoothing,2);
   Text=Text+", iSmooth "+DoubleToStr(IndexSmoothing,2);
   Text=Text+")  ";
   IndicatorShortName(Text);

   SetIndexLabel(1,NULL);
   SetIndexLabel(2,NULL);


   DrawStart=2*RangePeriods+4;             // DrawStart= BarNumber calculated from left to right
   SetIndexDrawBegin(1,DrawStart);
   SetIndexDrawBegin(2,DrawStart);

   if (PriceSmoothing>=1.0)
      {
      PriceSmoothing=0.9999;
      Alert("Fish61: PriceSmothing factor has to be smaller 1!");
      }
   if (PriceSmoothing<0)
      {
      PriceSmoothing=0;
      Alert("Fish61: PriceSmothing factor mustn''t be negative!");
      }

   if (IndexSmoothing>=1.0)
      {
      IndexSmoothing=0.9999;
      Alert("Fish61: PriceSmothing factor has to be smaller 1!");
      }
   if (IndexSmoothing<0)
      {
      IndexSmoothing=0;
      Alert("Fish61: PriceSmothing factor mustn''t be negative!");
      }

//----
   return(0);
  }
//+------------------------------------------------------------------+
//| Custom indicator deinitialization function                       |
//+------------------------------------------------------------------+
int deinit()
  {
//----

//----
   return(0);
  }
//+------------------------------------------------------------------+
//| Custom indicator iteration function                              |
//+------------------------------------------------------------------+
int start()
  {
   if (Bars<DrawStart)
      {
      Alert("Fish84: Not enough Bars loaded to calculate FisherIndicator with RangePeriods=",RangePeriods);
      return(-1);
      }
//----
   int    counted_bars=IndicatorCounted();
   if (counted_bars<0) return(-1);
   if (counted_bars>0) counted_bars--;
//----
   int Position=Bars-counted_bars;        // Position = BarPosition calculated from right to left
   int LeftNum1=Bars-Position;            // when more bars are loaded the Position of a bar changes but not its LeftNum
   if (LeftNum1<RangePeriods+1)Position=Bars-RangePeriods-1;

   while(Position>=0)
      {
      CalculateCurrentBar(Position);
      Position--;
      }

//----
   return(0);
  }

//+------------------------------------------------------------------+
//| Single Bar Calculation function                                  |
//+------------------------------------------------------------------+
int CalculateCurrentBar(int pos)
  {
   double  LowestLow, HighestHigh, GreatestRange, MidPrice;
   double  PriceLocation, SmoothedLocation, FishIndex, SmoothedFish;
//----
   LowestLow = Low[Lowest(NULL,0,MODE_LOW,RangePeriods,pos)];
   HighestHigh = High[Highest(NULL,0,MODE_HIGH,RangePeriods,pos)];
   if (HighestHigh-LowestLow<0.1*Point)HighestHigh=LowestLow+0.1*Point;
   GreatestRange=HighestHigh-LowestLow;
   MidPrice = (High[pos]+Low[pos])/2;


// PriceLocation in current Range
   if (GreatestRange!=0)
      {
      PriceLocation=(MidPrice-LowestLow)/GreatestRange;
      PriceLocation= 2.0*PriceLocation - 1.0;           // ->  -1 < PriceLocation < +1
      }
// Smoothing of PriceLocation
   ExtMapBuffer4[pos]=PriceSmoothing*ExtMapBuffer4[pos+1]+(1.0-PriceSmoothing)*PriceLocation;
   SmoothedLocation=ExtMapBuffer4[pos];
   if (SmoothedLocation> 0.99) SmoothedLocation= 0.99; // verhindert, dass MathLog unendlich wird
   if (SmoothedLocation<-0.99) SmoothedLocation=-0.99; // verhindert, dass MathLog minuns unendlich wird


// FisherIndex
   if(1-SmoothedLocation!=0) FishIndex=MathLog((1+SmoothedLocation)/(1-SmoothedLocation));
   else Alert("Fisher129: Unerlaubter Zustand bei Bar Nummer ",Bars-pos);

// Smoothing of FisherIndex
   ExtMapBuffer1[pos]=IndexSmoothing*ExtMapBuffer1[pos+1]+(1.0-IndexSmoothing)*FishIndex;
   if (Bars-pos<DrawStart)ExtMapBuffer1[pos]=0;
   SmoothedFish=ExtMapBuffer1[pos];


   if (SmoothedFish>0)     // up trend
      {
      ExtMapBuffer2[pos]=SmoothedFish;
      ExtMapBuffer3[pos]=0;
      }
   else                          // else down trend
      {
      ExtMapBuffer2[pos]=0;
      ExtMapBuffer3[pos]=SmoothedFish;
      }
//----
   return(0);
  }


//+------------------------------------------------------------------+
Comments