Fisher_org_v12
Download script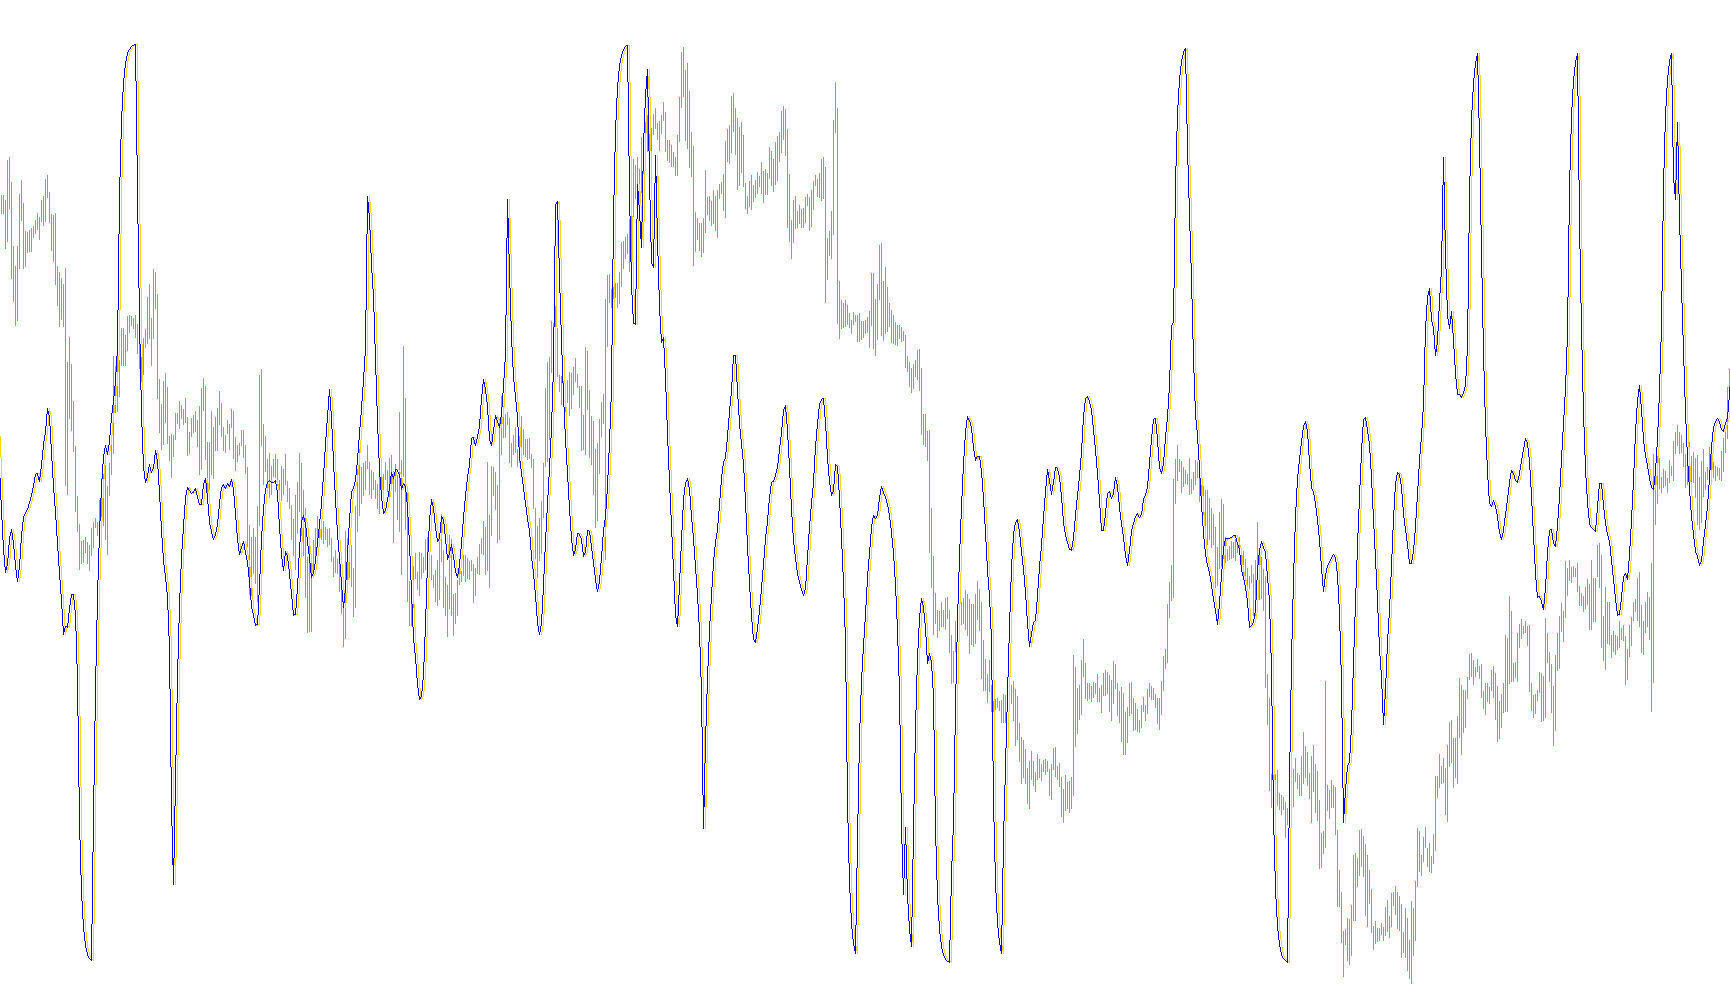
This technical tool is designed to help traders identify momentum and price trends by transforming standard market movements into a more readable visual format. Rather than looking at raw price action alone, which can often be "noisy" or volatile, this script uses a mathematical approach called the Fisher Transform to smooth out these fluctuations while preserving the essential direction of the trend.
How the Logic Works
The underlying logic follows a three-step process to turn raw market data into actionable visual signals:
1. Normalizing Price Movement (WPR Calculation) The script first looks at a specific window of recent candles (defined by the "Length" setting). It identifies the highest and lowest prices reached during that period. By comparing the current moving average price against these extremes, it calculates where the price sits on a scale from 0 to 1. Essentially, it answers the question: "Where is the current price relative to its recent highs and lows?"
2. Smoothing the Data To prevent the indicator from jumping erratically with every tiny price tick, the script applies a smoothing filter. It takes the result of the previous calculation and blends it with the current one. This creates a more fluid motion, helping the trader distinguish between minor "market noise" and actual sustained momentum. The script also includes safety limits to ensure the math stays within a functional range, preventing any erratic spikes that could occur during periods of extreme market activity.
3. The Fisher Transformation The final step is the core of the tool. It applies a logarithmic transformation to the smoothed data. This specific mathematical function is used to linearize price trends. In simpler terms, it "stretches" the data so that turning points (where a trend might be about to reverse) become much more obvious and easier for a human to spot on a chart.
Visual Output
The indicator provides two primary visual elements on your screen:
- The Main Line: This represents the primary Fisher Transform, showing the overall momentum of the market.
- The Trigger Line: This acts as a secondary signal, lagging slightly behind the main line to help confirm when the momentum is shifting significantly enough to warrant attention.
By using this logic, traders can better visualize whether the market is gaining strength, losing steam, or reaching an exhausted state, allowing for more informed entries and exits based on momentum rather than just raw price numbers.
//+------------------------------------------------------------------+
//|                                                Fisher_org_v1.mq4 |
//|                           Copyright © 2006, TrendLaboratory Ltd. |
//|            http://finance.groups.yahoo.com/group/TrendLaboratory |
//|                                       E-mail: igorad2004@list.ru |
//+------------------------------------------------------------------+
#property copyright "Copyright © 2005, TrendLaboratory Ltd."
#property link      "http://finance.groups.yahoo.com/group/TrendLaboratory"

#property indicator_separate_window
#property indicator_buffers 2
#property indicator_color1 LightBlue
#property indicator_color2 Tomato
//---- input parameters
extern int Length=10;
extern int Price=4;
extern int NumBars=0;
//---- buffers
double Buffer[];
double Value [];
double Fisher[];

int init()
  {
  IndicatorBuffers(3);

  SetIndexStyle(0,DRAW_LINE);
  SetIndexStyle(1,DRAW_LINE);

  SetIndexBuffer(0,Buffer);
  SetIndexBuffer(1,Fisher);
  SetIndexBuffer(2,Value);

  IndicatorShortName ("FisherTransform(" + Length + "," + Price + ")");
  SetIndexLabel (0, "Fish");
  SetIndexLabel (1, "Trigger");

  SetIndexDrawBegin(0,Length);
  SetIndexDrawBegin(1,Length);

  return(0);
  }


//+------------------------------------------------------------------+
//| Fisher_org_v1                                                         |
//+------------------------------------------------------------------+
int start()
  {
  int shift;

  double smin=0,smax=0;

if (NumBars>0) int NBars=NumBars; else NBars=Bars;

for(shift=NBars;shift>=0;shift--)
   {
   Buffer[shift]=0.0;
   Value [shift]=0.0;
   Fisher[shift]=0.0;
   }

for(shift=NBars-2-Length;shift>=0;shift--)
   {
   smax = High[Highest(NULL,0,MODE_HIGH,Length,shift)];
   smin = Low[Lowest(NULL,0,MODE_LOW,Length,shift)];

   double price = iMA(NULL,0,1,0,0,Price,shift);

   if (smax==smin) smax=smin+Point;

   double wpr=(price-smin)/(smax-smin);

   Value[shift] = (wpr-0.5) + 0.67*Value[shift+1];

   if (Value[shift]> 0.99) Value[shift]= 0.999;
   if (Value[shift]<-0.99) Value[shift]=-0.999;

   Fisher[shift] = 0.5*MathLog((1.0+Value[shift])/(1.0-Value[shift]))+0.5*Fisher[shift+1];
   Buffer[shift] = Fisher [shift+1];

   }
  return(0);
  }
//+------------------------------------------------------------------+
Comments