Filter_overWPR
Download script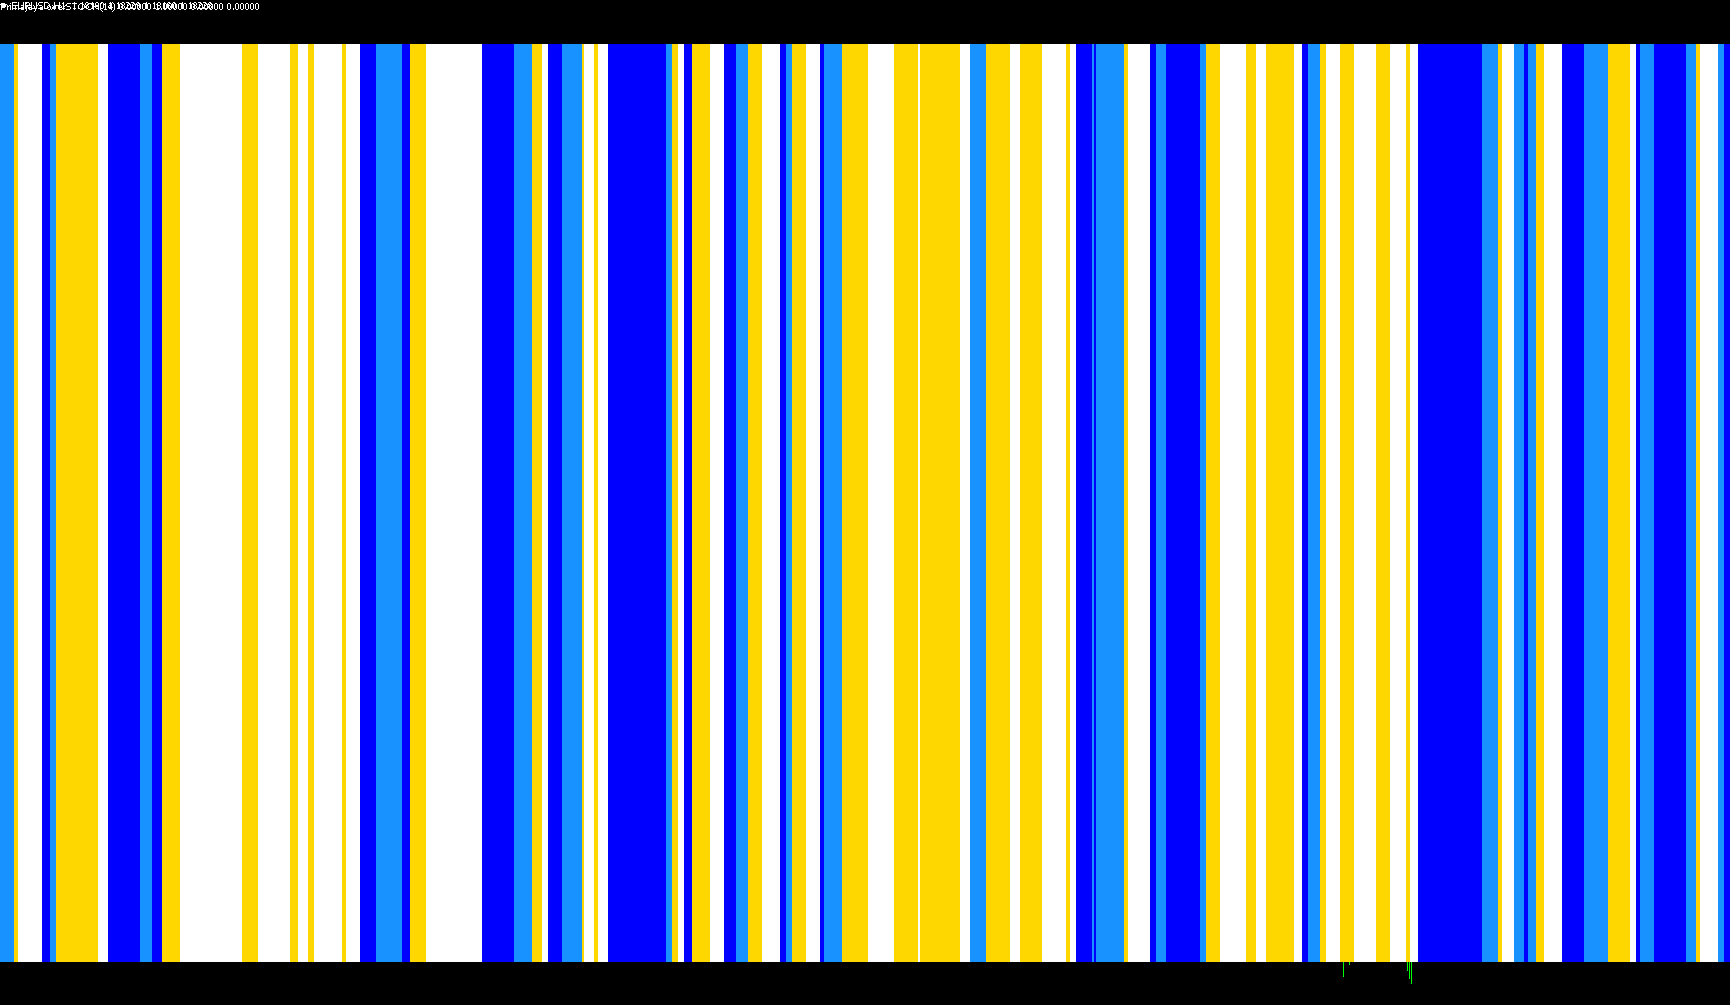
This tool is designed as a visual filtering system for traders who use the Stochastic Oscillator to identify momentum and price trends. Instead of showing complex raw data, it translates the movements of the Stochastic Oscillator into clear, color-coded visual signals that help distinguish between different market "moods."
Core Logic & Market Interpretation
The script analyzes two specific lines of the Stochastic Oscillator—the Main line (representing current momentum) and the Signal line (representing the average trend)—to categorize the market into four distinct states:
- Strong Bullish Momentum: When the indicator identifies that prices have enough upward velocity to potentially continue a move, it highlights a specific state.
- Strong Bearish Momentum: Conversely, when the price shows heavy downward pressure, the tool signals a high-strength bearish trend.
- Potential Bullish Trend: The script looks for "early" signs where the momentum is beginning to shift upward but hasn't reached extreme levels yet.
- Potential Bearish Trend: This identifies early stages of downward movement, signaling that price action may be starting to weaken.
Visual Indicators & Alerts
The logic organizes these four states into a visual histogram in a separate window on your trading chart. Each state is assigned a specific color and height, allowing you to see at a glance which trend is currently dominant:
- Strong Bears (Red)
- Strong Bulls (Blue)
- Potential to Bulls (Steel Blue)
- Potential to Bears (Orange)
Automated Notifications
To ensure traders do not miss critical shifts in market sentiment, the script includes an automated alert system. It constantly monitors the current "trend state" calculated by the logic. If the market shifts from one primary trend (for example, from Bullish to Bearish) to another, the script will trigger a visual and audible alert on your platform. This allows for faster reaction times when the momentum of the market changes direction.
Summary for the User
Essentially, this script acts as a "translator." It takes the raw mathematical data of the Stochastic Oscillator and simplifies it into a color-coded map. It tells you not just where the price is going, but how strong that movement is, helping you filter out market noise and identify high-probability trends more effectively.
//+------------------------------------------------------------------+
//|                                               Filter overWPR.mq4 |
//|                   Copyright © 2006, Indoforex Groups - Primajaya |
//|                                   http://primaforex.blogspot.com |
//+------------------------------------------------------------------+
#property copyright "Copyright © 2006, Indoforex Groups"
#property link      "http://primaforex.blogspot.com"
//----
#property indicator_separate_window
#property indicator_minimum -0.05
#property indicator_maximum 1.00
#property indicator_buffers 4
#property indicator_color1 Red
#property indicator_color2 Blue
#property indicator_color3 SteelBlue
#property indicator_color4 Orange
//---- input parameters
extern int PeriodeStoch=14;
extern int PercentD=3;
extern int Smooth=5;
//---- indicator buffers
double UpBuffer1[];
double DnBuffer1[];
double UpBuffer2[];
double DnBuffer2[];
int prevColor=0;
//+------------------------------------------------------------------+
//| Custom indicator initialization function                         |
//+------------------------------------------------------------------+
  int init()
  {
   string short_name;
//---- indicator line
   SetIndexStyle(0,DRAW_HISTOGRAM,STYLE_SOLID,2);
   SetIndexStyle(1,DRAW_HISTOGRAM,STYLE_SOLID,2);
   SetIndexStyle(2,DRAW_HISTOGRAM,STYLE_SOLID,2);
   SetIndexStyle(3,DRAW_HISTOGRAM,STYLE_SOLID,2);
//---
   SetIndexBuffer(0,UpBuffer1);
   SetIndexBuffer(1,DnBuffer1);
   SetIndexBuffer(2,UpBuffer2);
   SetIndexBuffer(3,DnBuffer2);
   IndicatorDigits(MarketInfo(Symbol(),MODE_DIGITS));
//---- name for DataWindow and indicator subwindow label
   short_name="Primajaya overSTOCH("+PeriodeStoch+")";
   IndicatorShortName(short_name);
   SetIndexLabel(0,"Strong Bears");
   SetIndexLabel(1,"Strong Bulls");
   SetIndexLabel(2,"Potential to Bulls");
   SetIndexLabel(3,"Potential to Bears");
//----
   SetIndexDrawBegin(0,PeriodeStoch);
   SetIndexDrawBegin(1,PeriodeStoch);
   SetIndexDrawBegin(2,PeriodeStoch);
   SetIndexDrawBegin(3,PeriodeStoch);
//----
   return(0);
  }
//+------------------------------------------------------------------+
//| ProSol Confirmation                                              |
//+------------------------------------------------------------------+
int start()
  {
   int shift,trend;
   double PK;
   double PD;
//----
   for(shift=Bars-PeriodeStoch-1;shift>=0;shift--)
     {
      PK=iStochastic(NULL, 0,PeriodeStoch,PercentD,Smooth,MODE_EMA,1,MODE_MAIN,shift);
      PD=iStochastic(NULL, 0,PeriodeStoch,PercentD,Smooth,MODE_EMA,1,MODE_SIGNAL,shift);
//----
      if (PK>20 && PK>PD && PK<40 && PD<40)  trend=1;
      if (PK<=20)  trend=2;
      if (PK<80 && PK<PD && PK>60 && PD>60) trend=3;
      if (PK>=80)  trend=4;
      if(shift==0 && prevColor!=0 && prevColor!=trend)
        {
         Alert(Symbol()+" ",Period()+" COLOR CHANGED");
         prevColor=trend;
        }
      if(prevColor==0 && shift==0)
         prevColor=trend;
      if (trend==1)
        {
         UpBuffer1[shift]=0;
         UpBuffer2[shift]=1;
         DnBuffer1[shift]=0;
         DnBuffer2[shift]=0;
        }
      if (trend==2)
        {
         UpBuffer1[shift]=1;
         UpBuffer2[shift]=0;
         DnBuffer1[shift]=0;
         DnBuffer2[shift]=0;
        }
      if (trend==3)
        {
         UpBuffer1[shift]=0;
         UpBuffer2[shift]=0;
         DnBuffer1[shift]=0;
         DnBuffer2[shift]=1;
        }
      if (trend==4)
        {
         UpBuffer1[shift]=0;
         UpBuffer2[shift]=0;
         DnBuffer1[shift]=1;
         DnBuffer2[shift]=0;
        }
     }
//----
   return(0);
  }
//+------------------------------------------------------------------+
Comments