Firebird-v63H-SafeArea-ind
Download script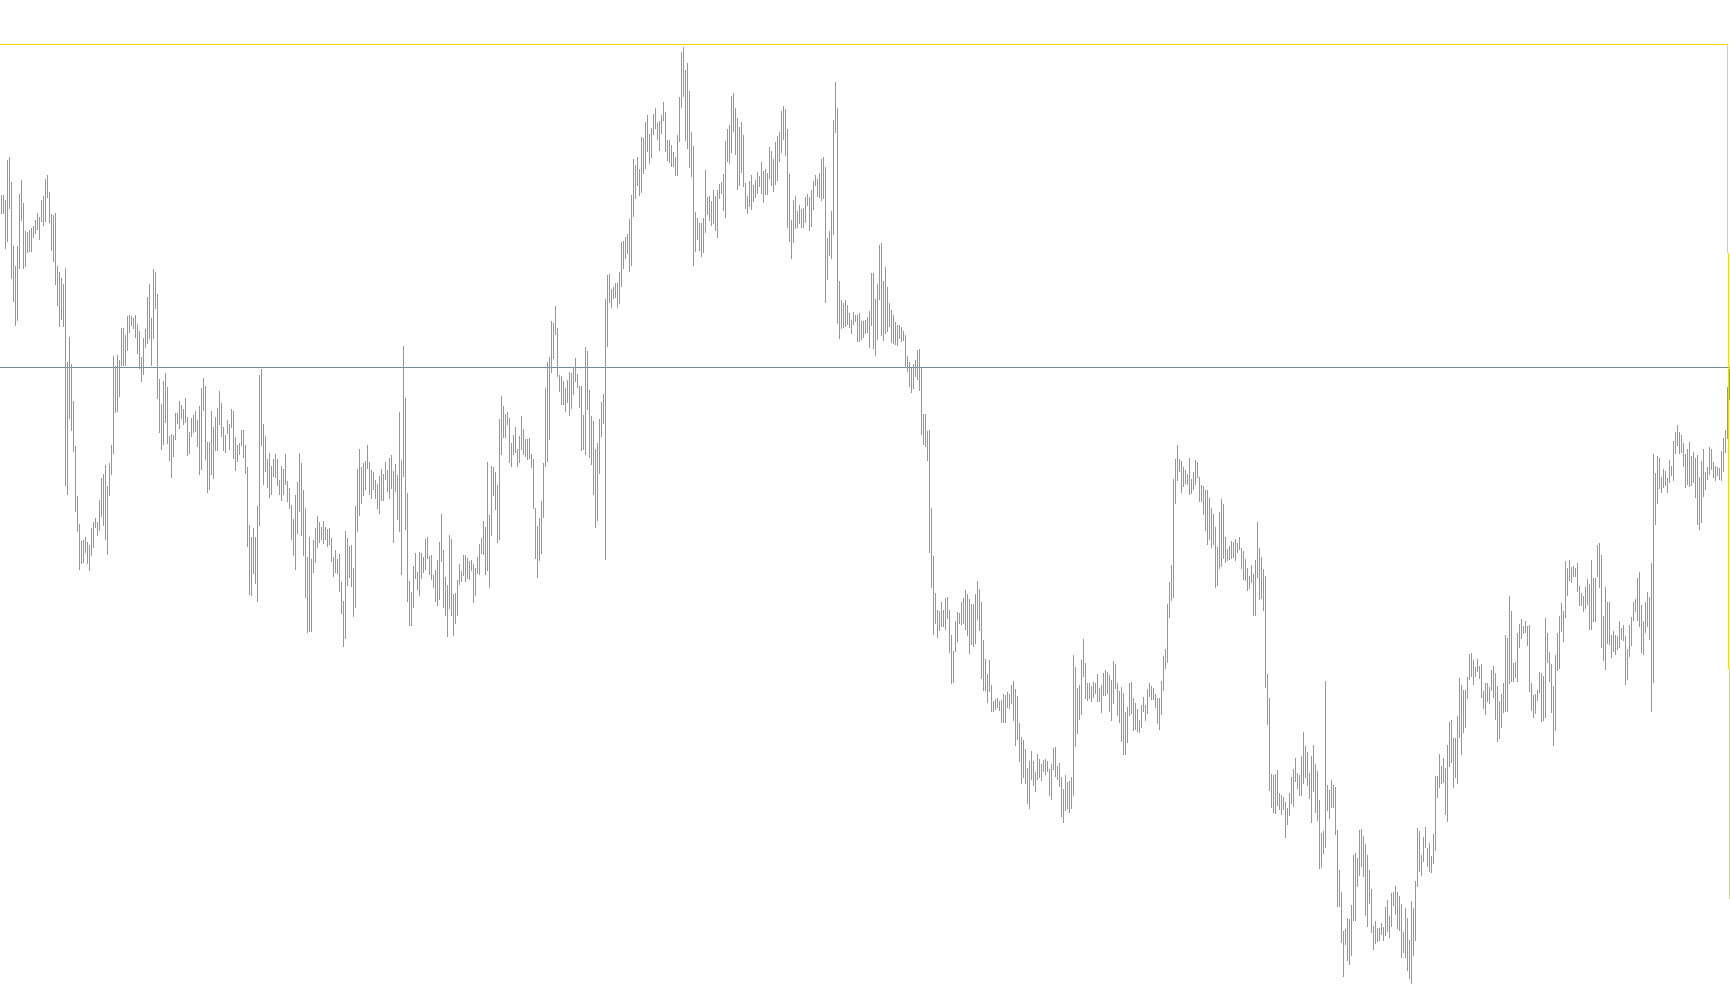
The Firebird Indicator is designed to provide traders with a visual representation of market stability and "safety zones" by analyzing the balance between buying and selling pressures. Rather than focusing on simple price movement, this tool evaluates the underlying momentum of the market to help identify periods of relative equilibrium.
Core Operational Logic
The indicator functions by calculating the combined strength of two opposing forces: "Bulls" (buyers) and "Bears" (sellers). It looks at specific historical data points across a user-defined timeframe to determine how much weight is being thrown into the market by both sides simultaneously.
How the Calculation Works:
- Momentum Summation: The script identifies the total power of the buyers and the total power of the sellers over a specific period. By combining these two forces, it creates a comprehensive picture of current market activity.
- Normalization: This combined strength is converted into a standardized numerical value (based on the asset's point value) so that it can be measured consistently across different types of currency pairs or assets.
- Safety Zone Mapping: The primary goal of the indicator is to measure how far the current market activity deviates from a predefined "Safe Area." It takes a fixed limit (the Safety Area) and subtracts the absolute value of the combined momentum from it.
Visual Interpretation
The result is plotted as a line on a separate window beneath your main price chart. Here is how to interpret the behavior:
- Stability: When the market is relatively balanced—meaning the strength of the buyers and sellers is roughly equal or low—the indicator will stay closer to its maximum defined "Safe Area."
- Volatility/Imbalance: As one side begins to dominate the other significantly, or as overall momentum spikes, the value on the chart will deviate. The distance from the peak represents the intensity of the market's current push in either direction.
By monitoring this line, traders can visually track whether the market is currently residing within a "safe" zone of equilibrium or if it is experiencing a surge in directional pressure that might signal a trend change or a period of high volatility.
//+------------------------------------------------------------------+
//|                                          Firebird Indicators.mq4 |
//|                                        Copyright © 2006, Swissly |
//|                                                                  |
//+------------------------------------------------------------------+
#property copyright "Copyright © 2006, Swissly"
#property link      ""

#property indicator_separate_window
#property indicator_buffers 1
#property indicator_color1 Red

//---- input parameters
extern int           TimeFrame   = 15;          // this indicatior can only be used in 1, 5, 15min timeframes
extern int           BPeriod     = 20;
extern int           SafeArea    = 40;
//---- buffers
double ExtMapBuffer1[];

//+------------------------------------------------------------------+
//| Custom indicator initialization function                         |
//+------------------------------------------------------------------+
int init()
{
//---- indicators
   SetIndexStyle(0,DRAW_LINE);
   SetIndexBuffer(0,ExtMapBuffer1);
   string short_name = "Firebird SafeArea ";
   IndicatorShortName(short_name);
//----
   return(0);
}

//+------------------------------------------------------------------+
//| Custom indicator deinitialization function                       |
//+------------------------------------------------------------------+
int deinit()
{
//----

//----
   return(0);
}


//+------------------------------------------------------------------+
//| Custom indicator iteration function                              |
//+------------------------------------------------------------------+
int start()
{
   datetime TimeArray[];
   int   counted_bars=IndicatorCounted();
   int   type, limit, spread, y=0, pos=0;

//---- check for possible errors
   if (counted_bars<0) return(-1);

//---- last counted bar will be recounted
   if (counted_bars>0) counted_bars--;

// Plot defined timeframe on to current timeframe
   ArrayCopySeries(TimeArray,MODE_TIME,Symbol(),TimeFrame);

//---- main calculation loop

   limit = Bars-counted_bars;
   for(pos=0,y=0;pos<limit;pos++)
   {
      if (Time[pos]<TimeArray[y]) y++;

      double Safe = iBullsPower(NULL,TimeFrame,BPeriod,PRICE_WEIGHTED,y)+iBearsPower(NULL,TimeFrame,BPeriod,PRICE_WEIGHTED,y);
      Safe=Safe/Point;
      ExtMapBuffer1[pos] = SafeArea - MathAbs(Safe);
   }

//----
   return(0);
} // end of main program loop
//+------------------------------------------------------------------+
Comments