CandleBreaker
Download script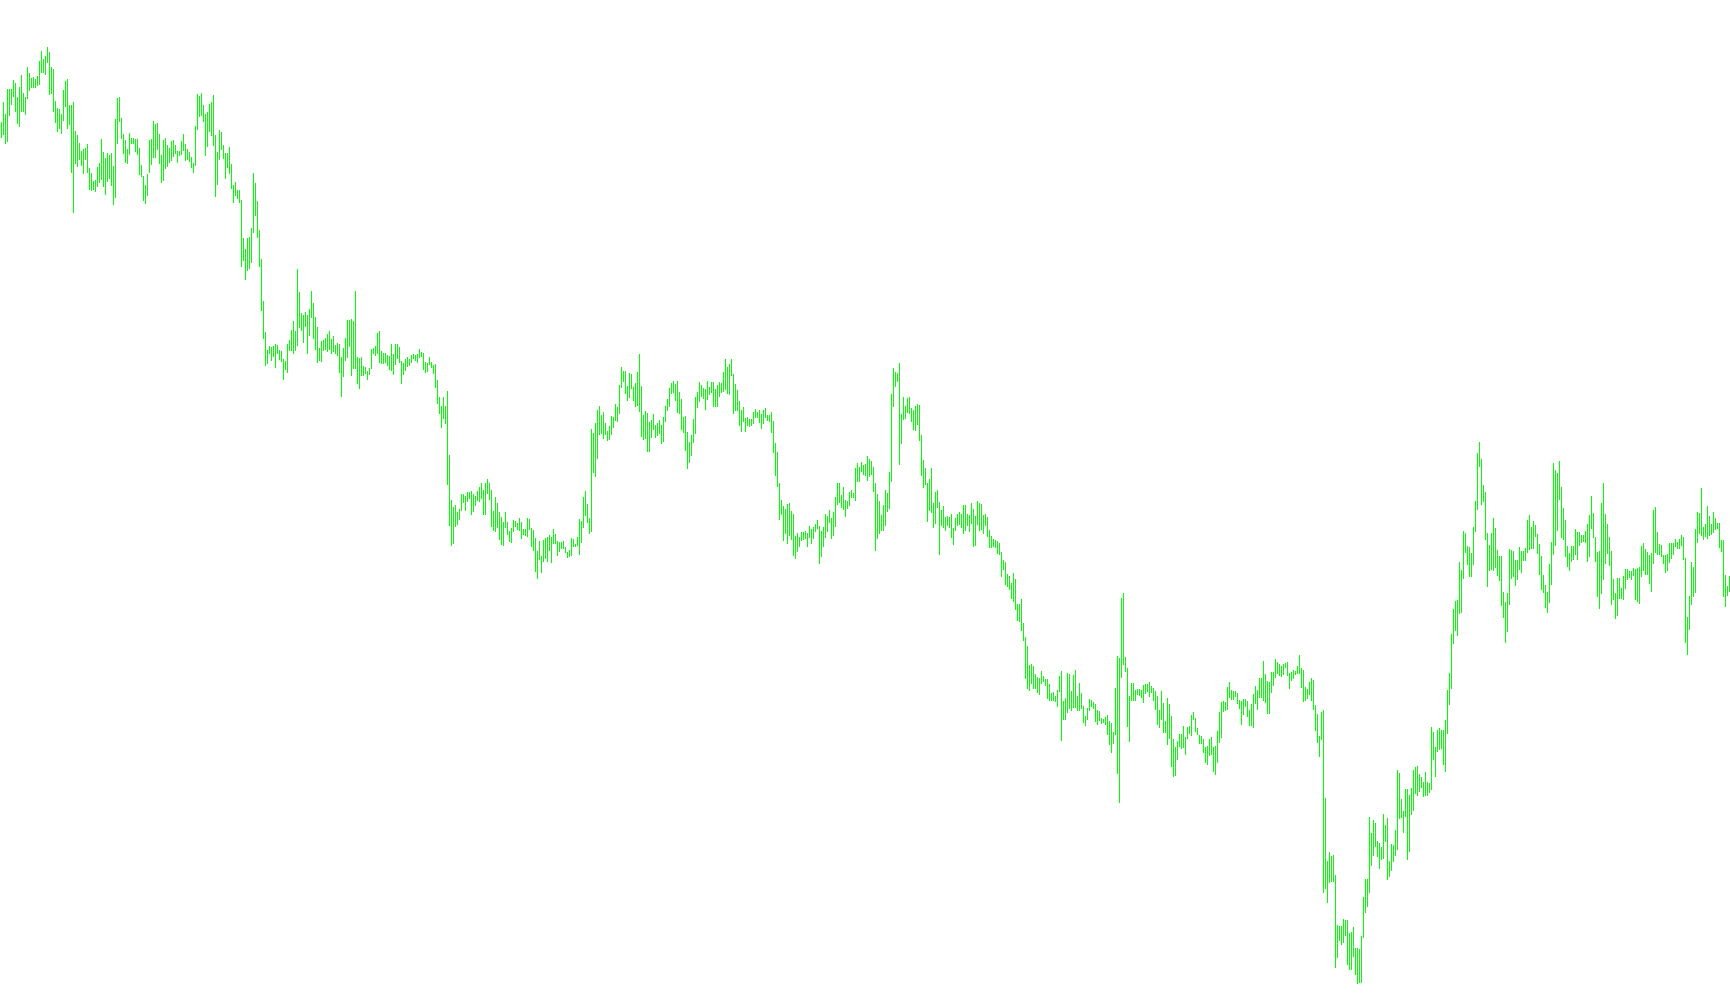
This script is designed to identify specific structural patterns in price action, specifically focusing on "Hook Breaks" within prevailing market trends. It functions as a visual tool that detects shifts between uptrends and downtrends by monitoring price extremes and significant momentum shifts.
Core Logic and Functionality
Structural Identification (Fractals) The script continuously scans historical price data to locate "Fractals." In market analysis, these represent local highs and lows—essentially the "peaks" and "valleys" of price movement. The tool uses these points as structural anchors to determine the current boundaries of the market's range.
Dynamic Trend Tracking The logic operates by maintaining a memory of the most recent significant high and low points. It monitors the current price in real-time:
- New Highs: If the market pushes above a previously established high, the script updates its records to recognize this new structural ceiling.
- New Lows: If the price drops below an established low, it updates the structural floor.
Hook Break Detection The primary objective of the script is to identify "Hook Breaks." This happens when the price reacts to a structural boundary in a specific way:
- Trend Reversal Signals: It looks for moments where the price closes significantly above a previous high (suggesting a bullish breakout) or below a previous low (suggesting a bearish breakdown).
- State Switching: The script maintains an internal state (a "trend direction"). When a confirmed breakout occurs, it flips this state. If the market breaks to the upside, it marks the environment as bullish; if it breaks to the downside, it marks it as bearish.
Visual Output The tool translates these mathematical detections into visual histograms on your chart:
- Downtrend Highlights: When the logic confirms a bearish breakdown, the script colors the bars to indicate a "HookBreak Downtrend."
- Uptrend Highlights: When the logic confirms a bullish breakout, it colors the bars to indicate a "HookBreak Uptrend."
Summary of Behavior
Instead of simply following a moving average or a simple price cross, this script waits for the market to "break" its existing structure. It identifies when the price has moved far enough to invalidate previous peaks or valleys and provides a visual signal (via colored histograms) to notify the user that a structural trend shift has likely occurred.
#property  indicator_chart_window
#property  indicator_buffers 4
#property  indicator_color1  Red
#property  indicator_color2  GreenYellow
#property  indicator_color3  Red
#property  indicator_color4  GreenYellow


extern int    viewableBars = 300;
double var_80;
double var_88;
double var_96;
double var_104;
double var_112;
double var_120, var_128, var_136;
string var_144;
int    var_152;
int    var_156;
int    var_160;
int    var_164;
int    var_168;
int    var_172;
int    end_day;
int    end_month;
int    end_year;
int    begin_day;
int    begin_month;
int    begin_year;
string begin_date;
string end_date;
string end_day_s;
string end_month_s;
string begin_day_s;
string begin_month_s;
bool   expired = False;
double ind_buffer0[];
double ind_buffer1[];
double ind_buffer2[];
double ind_buffer3[];


//+------------------------------------------------------------------+

int init()
{
begin_day = 30;
begin_month = 10;
begin_year = 2005;
end_day = 2;
end_month = 12;
end_year = 2008;
if (Bars < viewableBars) viewableBars = Bars;

if (end_day < 10)     end_day_s = "0" + end_day; else end_day_s = end_day;
if (end_month < 10)   end_month_s = "0" + end_month; else end_month_s = end_month;
if (begin_day < 10)   begin_day_s = "0" + begin_day; else begin_day_s = begin_day;
if (begin_month < 10) begin_month_s = "0" + begin_month; else begin_month_s = begin_month;
begin_date = begin_year + "." + begin_month_s + "." + begin_day_s;
end_date = end_year + "." + end_month_s + "." + end_day_s;

SetIndexStyle(0,DRAW_HISTOGRAM,STYLE_SOLID,1);
SetIndexStyle(1,DRAW_HISTOGRAM,STYLE_SOLID,1);
SetIndexStyle(2,DRAW_HISTOGRAM,STYLE_SOLID,2);
SetIndexStyle(3,DRAW_HISTOGRAM,STYLE_SOLID,2);
SetIndexBuffer(0,ind_buffer0);
SetIndexBuffer(1,ind_buffer1);
SetIndexBuffer(2,ind_buffer2);
SetIndexBuffer(3,ind_buffer3);
SetIndexLabel(0,"MP - HookBreak Downtrend");
SetIndexLabel(1,"MP - HookBreak Uptrend");
SetIndexLabel(2,"MP - HookBreak Downtrend");
SetIndexLabel(3,"MP - HookBreak Uptrend");

IndicatorDigits(MarketInfo(Symbol(),MODE_DIGITS));
IndicatorShortName("MP - HookBreak");
return(0);
}

//+------------------------------------------------------------------+

int deinit()
{
return(0);
}

//+------------------------------------------------------------------+

int start()
{
int vbars;
int counted_bars;
int cnt;

counted_bars = IndicatorCounted();
if (counted_bars < 0) return(EMPTY);
if (counted_bars > 0) counted_bars--;

if ((viewableBars <= 0) || (Bars < viewableBars)) vbars = Bars - 10; else vbars = viewableBars;

for (cnt = vbars; cnt >= 0; cnt--)
   {
   if (expired)
      {
      ObjectsDeleteAll();
      break;
      }
   while (var_168 == 0)
      {
      var_164++;
      if (iFractals(NULL,0,MODE_LOWER,cnt + var_164) != 0.0)
         {
         var_80 = iFractals(NULL,0,MODE_LOWER,cnt + var_164);
         var_120 = iFractals(NULL,0,MODE_LOWER,cnt + var_164);
         GlobalVariableSet(Symbol() + "-LFL",var_80);
         GlobalVariableSet(Symbol() + "-LL",var_120);
         var_164 = 0;
         break;
         }
      }
   while (var_172 == 0)
      {
      var_164++;
      if (iFractals(NULL,0,MODE_UPPER,cnt + var_164) != 0.0)
         {
         var_88 = iFractals(NULL,0,MODE_UPPER,cnt + var_164);
         var_96 = iFractals(NULL,0,MODE_UPPER,cnt + var_164);
         GlobalVariableSet(Symbol() + "-LFH",var_88);
         GlobalVariableSet(Symbol() + "-LH",var_96);
         var_164 = 0;
         break;
         }
      }
   if (High[cnt] > var_96)
      {
      var_104 = var_96;
      var_96 = High[cnt];
      GlobalVariableSet(Symbol() + "-LH",var_96);
      var_144 = "H";
      var_156 = Time[cnt];
      var_152 = 1;
      GlobalVariableSet(Symbol() + "-HBT",var_152);
      }
   if (Low[cnt] < var_120)
      {
      var_112 = var_120;
      var_120 = Low[cnt];
      GlobalVariableSet(Symbol() + "-LL",var_96);
      var_144 = "L";
      var_160 = Time[cnt];
      var_152 = -1;
      GlobalVariableSet(Symbol() + "-HBT",var_152);
      }
   if ((var_160 == var_156) && (Time[cnt] == var_160))
      {
      if (Close[cnt] > var_88)
         {
         var_104 = var_96;
         var_96 = High[cnt];
         GlobalVariableSet(Symbol() + "-LH",var_96);
         var_144 = "H";
         var_152 = 1;
         GlobalVariableSet(Symbol() + "-HBT",var_152);
         }
      if (Close[cnt] < var_80)
         {
         var_112 = var_120;
         var_120 = Low[cnt];
         GlobalVariableSet(Symbol() + "-LL",var_96);
         var_144 = "L";
         var_152 = -1;
         GlobalVariableSet(Symbol() + "-HBT",var_152);
         }
      }
   if (var_152 == -1)
      {
      ind_buffer0[cnt] = High[cnt];
      ind_buffer1[cnt] = Low[cnt];
      if (Open[cnt] > Close[cnt])
         {
         ind_buffer2[cnt] = Open[cnt];
         ind_buffer3[cnt] = Close[cnt];
         }
            else
         {
         ind_buffer3[cnt] = Open[cnt];
         ind_buffer2[cnt] = Close[cnt];
         }
      }
         else
      {
      ind_buffer1[cnt] = High[cnt];
      ind_buffer0[cnt] = Low[cnt];
      if (Open[cnt] < Close[cnt])
         {
         ind_buffer2[cnt] = Open[cnt];
         ind_buffer3[cnt] = Close[cnt];
         }
            else
         {
         ind_buffer3[cnt] = Open[cnt];
         ind_buffer2[cnt] = Close[cnt];
         }
      }
   }
return(0);
}
Comments