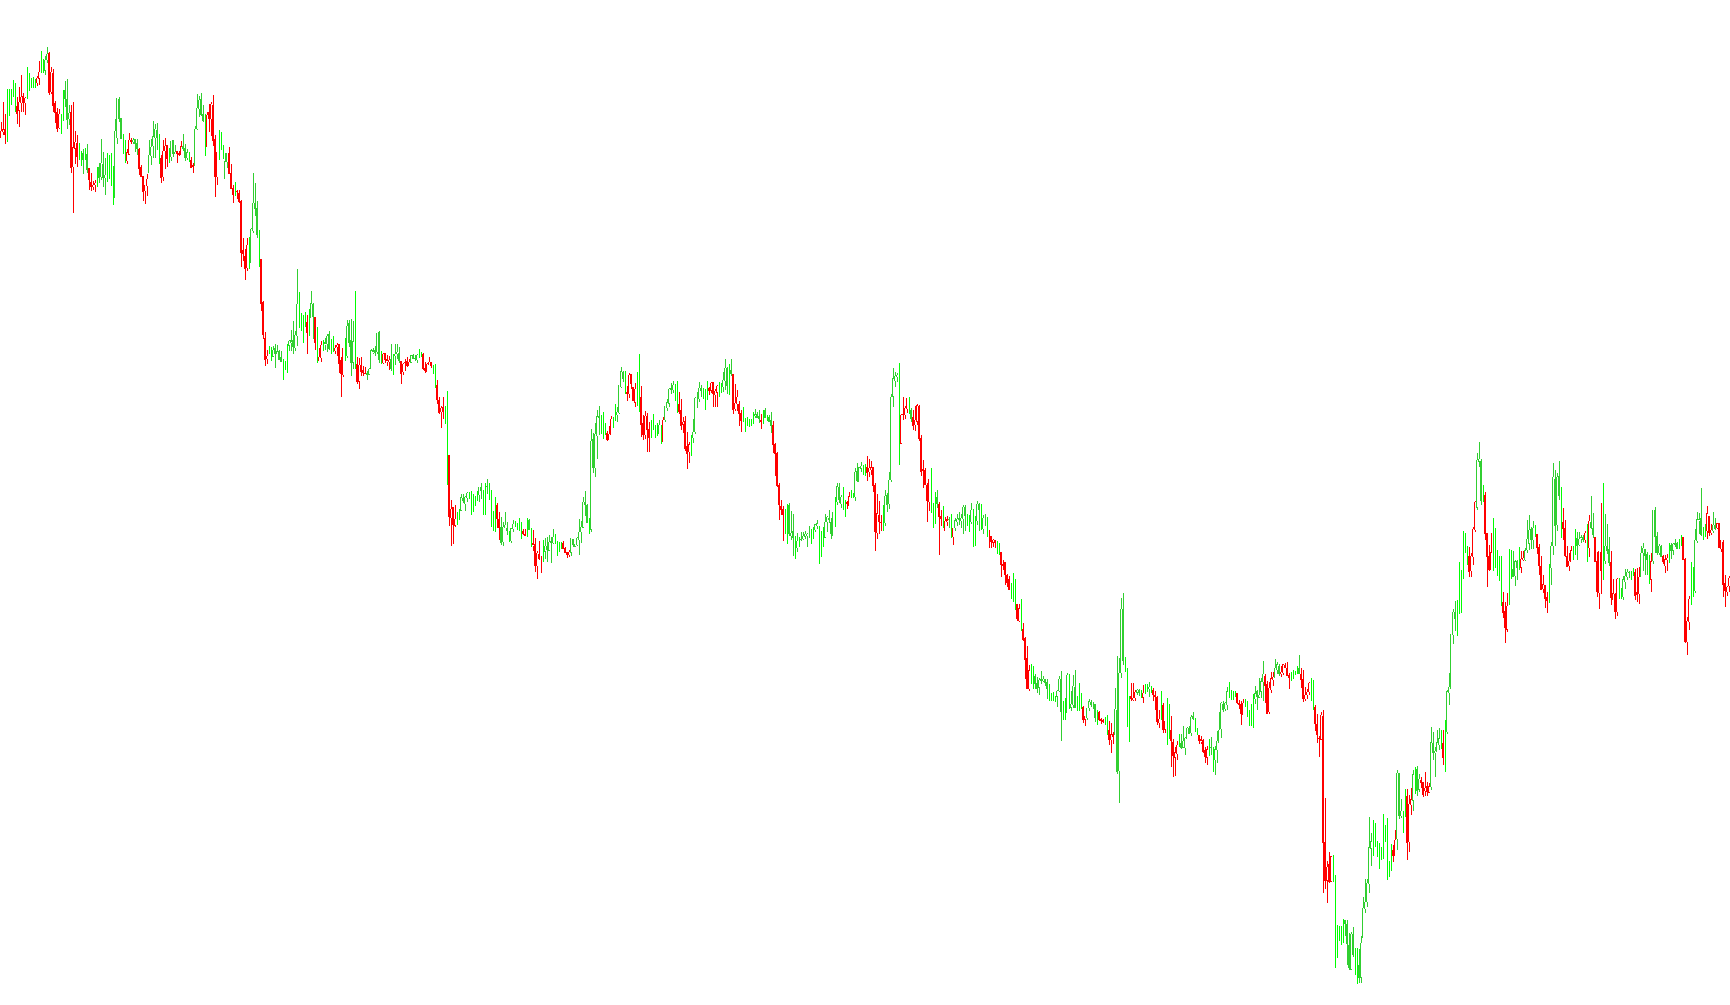
Here's a breakdown of what this script does, explained in plain language:
This script is designed to visually highlight price movements on a trading chart using color-coded candlesticks, based on a specific set of rules likely derived from the trading ideas of someone named Williams (implied by the comments). It paints these candlesticks based on the relationship between the Awesome Oscillator (AO) and the Accelerator Oscillator (AC) indicators, as well as the relationship between the Open and Close prices of each candlestick.
Here?s how it works:
-
Initialization: When the script starts, it sets up several "drawing areas" on the chart. These areas will be used to display the colored candlesticks. Each area is assigned a specific color (LimeGreen, Red, White) and a drawing style (histogram - like a bar chart).
-
Data Collection: The script goes back through the historical price data on the chart, one candlestick at a time. It starts from the most recent candlestick and works its way backwards.
-
Rule-Based Coloring: For each candlestick, the script checks the following:
-
AO and AC Comparison: It compares the values of the Awesome Oscillator (AO) and the Accelerator Oscillator (AC) for the current candlestick with the values from the previous candlestick.
-
Price Relationships: It also looks at whether the Open price is higher or lower than the Close price of the current candlestick.
-
Color Assignment: Based on these comparisons, it assigns colors to the candlestick as follows:
- If both the AO and AC are higher than the previous candlestick, or both are lower than the previous candlestick, then:
- The "high" and "low" values are stored, and also inverted depending on which condition is met
- If the Open is greater than the Close, the color will be used to paint the "open" and "close" price of the current candlestick.
- If the Open is less than the Close, the color will be used to paint the "open" and "close" price of the current candlestick. The Open and Close prices are slightly adjusted.
- If both the AO and AC are higher than the previous candlestick, or both are lower than the previous candlestick, then:
-
-
Visual Display: Finally, the script displays the colored candlesticks on the chart, using the colors and drawing styles that were defined during initialization. It essentially creates a visual representation of the relationships between the AO, AC, and price movements.
//+------------------------------------------------------------------+
//|                                               CandlesticksBW.mq4 |
//|                                                         Vladimir |
//|                                         finance@allmotion.com.ua |
//+------------------------------------------------------------------+
// Ðàñêðàñêà ñâå÷åé ïî Âèëüÿìñó
#property copyright "Vladimir"
#property link      "finance@allmotion.com.ua"

#property indicator_chart_window
#property indicator_buffers 7
#property indicator_color1 LimeGreen
#property indicator_color2 Red
#property indicator_color3 LimeGreen
#property indicator_color4 Red
#property indicator_color5 White

//---- buffers
double ExtMapBuffer1[];
double ExtMapBuffer2[];
double ExtMapBuffer3[];
double ExtMapBuffer4[];
double ExtMapBuffer5[];
double ExtMapBuffer6[];
double ExtM;//----
int ExtCountedBars=0;

//+------------------------------------------------------------------+
//| Custom indicator initialization function                         |
//+------------------------------------------------------------------+
int init()
  {
//---- indicators
   SetIndexStyle(0,DRAW_HISTOGRAM,0,1,LimeGreen);
   SetIndexBuffer(0,ExtMapBuffer1);
   SetIndexStyle(1,DRAW_HISTOGRAM,0,1,Red);
   SetIndexBuffer(1,ExtMapBuffer2);
   SetIndexStyle(2,DRAW_HISTOGRAM,0,2,LimeGreen);
   SetIndexBuffer(2,ExtMapBuffer3);
   SetIndexStyle(3,DRAW_HISTOGRAM,0,2,Red);
   SetIndexBuffer(3,ExtMapBuffer4);
   SetIndexStyle(4,DRAW_HISTOGRAM,0,1,White);
   SetIndexBuffer(4,ExtMapBuffer5);
   SetIndexStyle(5,DRAW_HISTOGRAM,0,1,White);
   SetIndexBuffer(5,ExtMapBuffer6);
   SetIndexStyle(4,DRAW_NONE,0,1,LimeGreen);

   return(0);
  }

int start()
  {ExtM=Point;
   if (Bars<=10) return(0);
   ExtCountedBars=IndicatorCounted();
//---- check for possible errors
   if (ExtCountedBars<0) return(-1);
//---- last counted bar will be recounted
   if (ExtCountedBars>0) ExtCountedBars--;
   int pos=Bars-ExtCountedBars-1;

   while (pos>=0)
     {
        	if (iAO(NULL,0,pos)>=iAO(NULL,0,pos+1) && iAC(NULL,0,pos)>=iAC(NULL,0,pos+1))
          {
           ExtMapBuffer1[pos]=High[pos];
           ExtMapBuffer2[pos]=Low[pos];
           if (Open[pos]>Close[pos])
             { ExtMapBuffer3[pos]=Open[pos]; ExtMapBuffer4[pos]=Close[pos]; }
         else
           if (Open[pos]<Close[pos])
             { ExtMapBuffer3[pos]=Close[pos]; ExtMapBuffer4[pos]=Open[pos];
             ExtMapBuffer5[pos]=Open[pos]+ExtM;  ExtMapBuffer6[pos]=Close[pos]-ExtM;  }
           }
         if (iAO(NULL,0,pos)<=iAO(NULL,0,pos+1) && iAC(NULL,0,pos)<=iAC(NULL,0,pos+1))
	     	 {
           ExtMapBuffer1[pos]=Low[pos];
           ExtMapBuffer2[pos]=High[pos];
           if (Open[pos]<Close[pos])
             { ExtMapBuffer3[pos]=Open[pos]; ExtMapBuffer4[pos]=Close[pos];
               ExtMapBuffer5[pos]=Open[pos]+ExtM; ExtMapBuffer6[pos]=Close[pos]-ExtM;}
           else
             if (Open[pos]>Close[pos])
               { ExtMapBuffer3[pos]=Close[pos]; ExtMapBuffer4[pos]=Open[pos]; }
	  	       }
 	   pos--;
     }
   return(0);
  }
Comments