Camarilla_v2
Download script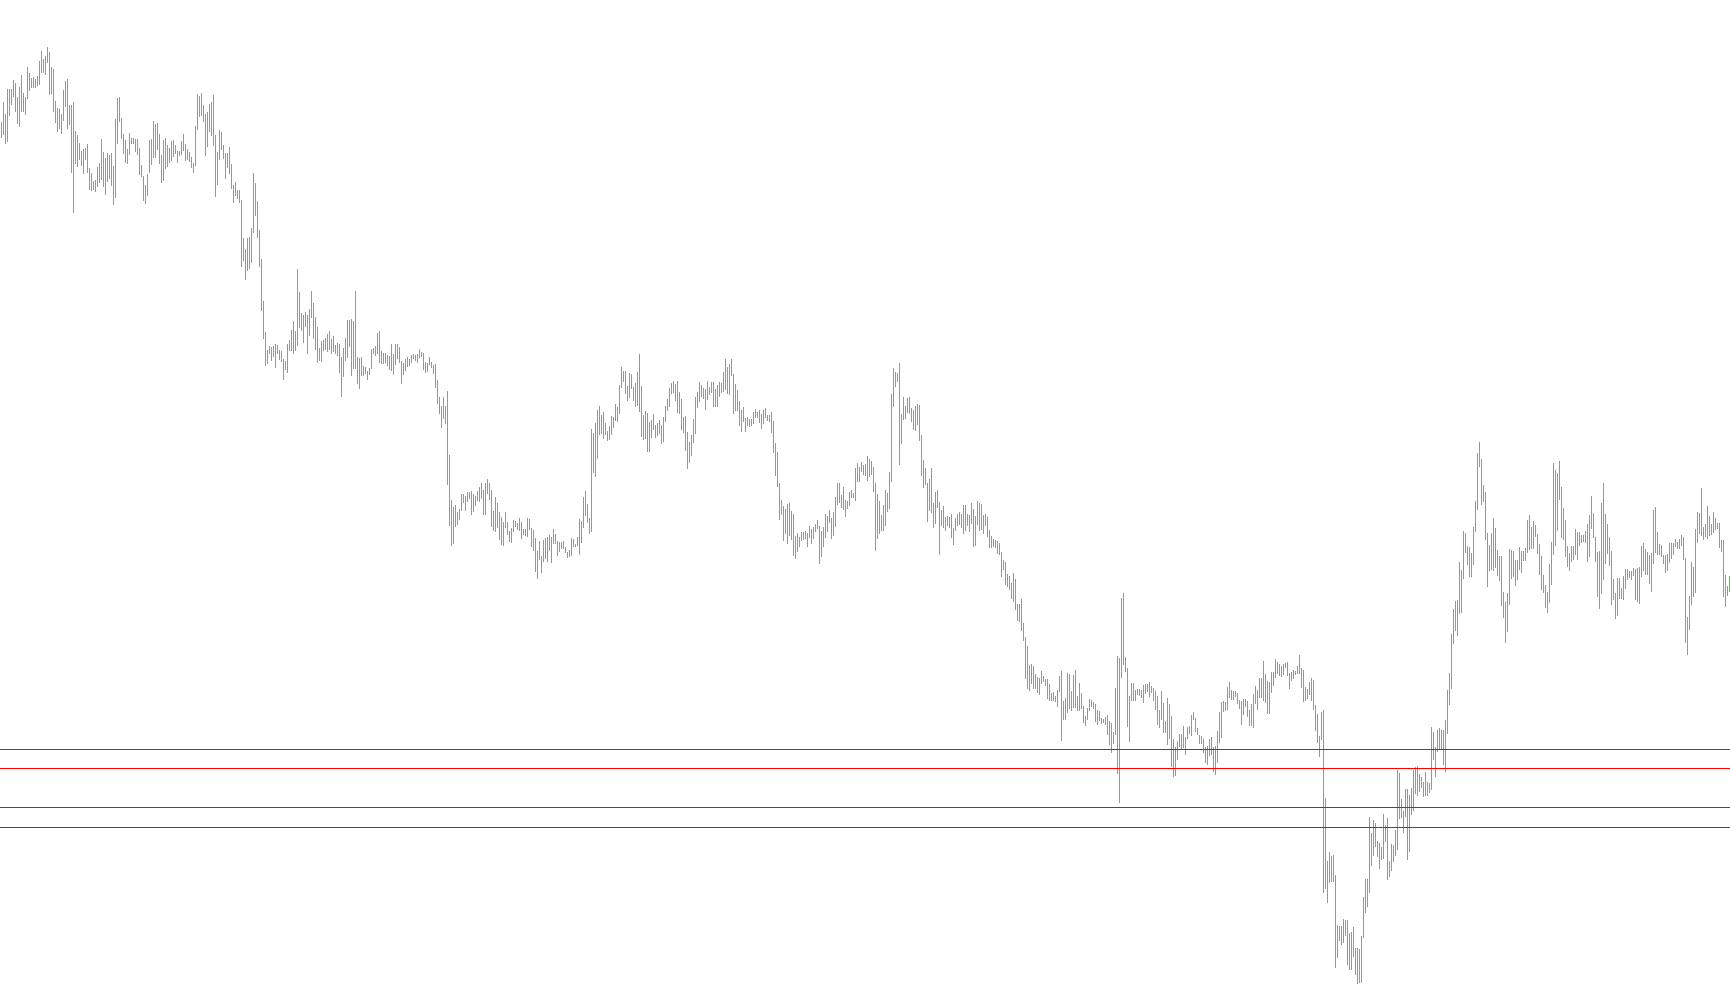
This script is designed to automate the calculation and visualization of Camarilla Pivot Point levels on a trading chart. These levels are commonly used by traders to identify potential support and resistance zones based on the price action of the previous trading day.
Core Logic Overview
The primary objective of this tool is to analyze historical price data from the preceding day to project specific price boundaries onto the current trading session. It automates a mathematical process that would otherwise require manual calculation, ensuring that these critical levels are always accurately represented on your screen.
How the Script Works
The script follows a systematic three-step process to provide you with visual data:
1. Data Collection and Time Synchronization First, the script scans through recent historical price bars to isolate the specific highs, lows, and closing prices of the previous day. It includes a "GMT shift" setting to ensure that it correctly identifies these boundaries regardless of your local time zone or the broker's server time. If you attempt to run this on a timeframe larger than one day (such as a weekly chart), the script will alert you to switch to a lower timeframe for accuracy.
2. Mathematical Pivot Calculations Once the previous day's data is captured, the script applies specific Camarilla formulas to calculate four key levels:
- H3 and L3: These represent the "intermediate" range and are often watched for intraday price consolidation.
- H4 and L4: These represent the "breakout" levels, which signify stronger potential resistance or support boundaries.
- P (Pivot Point): The script also calculates a central equilibrium point based on the average of the previous day's range.
3. Automated Visual Rendering After performing the math, the script handles the heavy lifting of drawing the technical indicators on your chart:
- Horizontal Lines: It automatically draws solid red lines at the H3, H4, L3, and L4 levels across your current view.
- Dynamic Labeling: To ensure clarity, the script places text labels (e.g., "H4", "L3") directly on these lines. These labels are programmed to move with the current price action, ensuring they remain visible and relevant as the market moves.
Summary for the Trader
Essentially, this tool takes the raw data from yesterday's market performance and converts it into a visual roadmap for today. By automatically plotting these levels, it allows you to see at a glance where major "ceilings" and "floors" are likely to occur, helping you make more informed decisions on where to enter or exit a trade.
//+------------------------------------------------------------------+
//|                                             ForexMasterMaker.com |
//|                                                       Pivots.mq4 |
//+------------------------------------------------------------------+
#property copyright "ForexMasterMaker.com, © 2005"
#property link      "http://www.forexmastermaker.com."
//----
#property indicator_chart_window
//---- input parameters
extern int       GMTshift=7;
//+------------------------------------------------------------------+
//| Custom indicator initialization function                         |
//+------------------------------------------------------------------+
int init()
  {
//---- indicators
//----
   return(0);
  }
//+------------------------------------------------------------------+
//| Custor indicator deinitialization function                       |
//+------------------------------------------------------------------+
int deinit()
  {
//----
   return(0);
  }
//+------------------------------------------------------------------+
//| Custom indicator iteration function                              |
//+------------------------------------------------------------------+
int start()
  {
   int    counted_bars=IndicatorCounted();
//---- TODO: add your code here
   double day_high=0;
   double day_low=0;
   double yesterday_high=0;
   double yesterday_open=0;
   double yesterday_low=0;
   double yesterday_close=0;
   double today_open=0;
   double P=0,S=0,R=0,S1=0,H4=0,S2=0,R2=0,S3=0,L4=0,nQ=0,nD=0,D=0;
   double H3,H2,H1,L1,L2,L3;
   int cnt=720;
   double cur_day=0;
   double prev_day=0;
   double rates_d1[2][6];
//---- exit if period is greater than daily charts
   if(Period() > 1440)
     {
      Print("Error - Chart period is greater than 1 day.");
      return(-1); // then exit
     }
//---- Get new daily prices & calculate pivots
   while(cnt!= 0)
     {
      cur_day=TimeDay(Time[cnt]- (GMTshift*3600));
      if (prev_day!=cur_day)
        {
         yesterday_close=Close[cnt+1];
         today_open=Open[cnt];
         yesterday_high=day_high;
         yesterday_low=day_low;
//----
         day_high=High[cnt];
         day_low =Low[cnt];
//----
         prev_day=cur_day;
        }
      if (High[cnt]>day_high)
        {
         day_high=High[cnt];
        }
      if (Low[cnt]<day_low)
        {
         day_low=Low[cnt];
        }
      //	SetIndexValue(cnt, 0);
      cnt--;
     }
//------ Pivot Points ------
   P=(yesterday_high + yesterday_low + yesterday_close)/3;
   H4=(yesterday_high - yesterday_low)*0.55+yesterday_close;
   H3=(yesterday_high - yesterday_low)*0.275+yesterday_close;
   L3=yesterday_close-(yesterday_high - yesterday_low)*0.275;
   L4=yesterday_close-(yesterday_high - yesterday_low)*0.55;
//------ DRAWING LINES ------
   Comment("Camarilla Levels by www.ForexMasterMaker.com");
//----
   ObjectDelete("L4_Line");
   ObjectDelete("L3_Line");
   ObjectDelete("H3_Line");
   ObjectDelete("H4_Line");
   ObjectCreate("L4_Line", OBJ_HLINE,0, CurTime(),L4);
   ObjectSet("L4_Line",OBJPROP_COLOR,Red);
   ObjectSet("L4_Line",OBJPROP_STYLE,STYLE_SOLID);
   ObjectCreate("L3_Line", OBJ_HLINE,0, CurTime(),L3);
   ObjectSet("L3_Line",OBJPROP_COLOR,Red);
   ObjectSet("L3_Line",OBJPROP_STYLE,STYLE_SOLID);
   ObjectCreate("H3_Line", OBJ_HLINE,0, CurTime(),H3);
   ObjectSet("H3_Line",OBJPROP_COLOR,Red);
   ObjectSet("H3_Line",OBJPROP_STYLE,STYLE_SOLID);
   ObjectCreate("H4_Line", OBJ_HLINE,0, CurTime(),H4);
   ObjectSet("H4_Line",OBJPROP_COLOR,Red);
   ObjectSet("H4_Line",OBJPROP_STYLE,STYLE_SOLID);
   ObjectsRedraw();
   // --- Typing Labels
   if(ObjectFind("L3 label")!=0)
     {
      ObjectCreate("L3 label", OBJ_TEXT, 0, Time[0], L3);
      ObjectSetText("L3 label", " L3 ", 8, "Arial", Red);
     }
   else
     {
      ObjectMove("L3 label", 0, Time[0], L3);
     }
   if(ObjectFind("L4 label")!=0)
     {
      ObjectCreate("L4 label", OBJ_TEXT, 0, Time[0], L4);
      ObjectSetText("L4 label", " L4 ", 8, "Arial", Red);
     }
   else
     {
      ObjectMove("L4 label", 0, Time[0], L4);
     }
   if(ObjectFind("H4 label")!=0)
     {
      ObjectCreate("H4 label", OBJ_TEXT, 0, Time[0], H4);
      ObjectSetText("H4 label", " H4 ", 8, "Arial", Red);
     }
   else
     {
      ObjectMove("H4 label", 0, Time[0], H4);
     }
   if(ObjectFind("H3 label")!=0)
     {
      ObjectCreate("H3 label", OBJ_TEXT, 0, Time[0], H3);
      ObjectSetText("H3 label", " H3 ", 8, "Arial", Red);
     }
   else
     {
      ObjectMove("H3 label", 0, Time[0], H3);
     }
   if(ObjectFind("P label")!=0)
     {
      ObjectCreate(" label", OBJ_TEXT, 0, Time[0], H3);
      ObjectSetText(" label", "  ", 8, "Arial", DeepPink);
     }
   else
     {
      ObjectMove("P label", 0, Time[0], P);
     }
   return(0);
  }
 //+------------------------------------------------------------------+
Comments