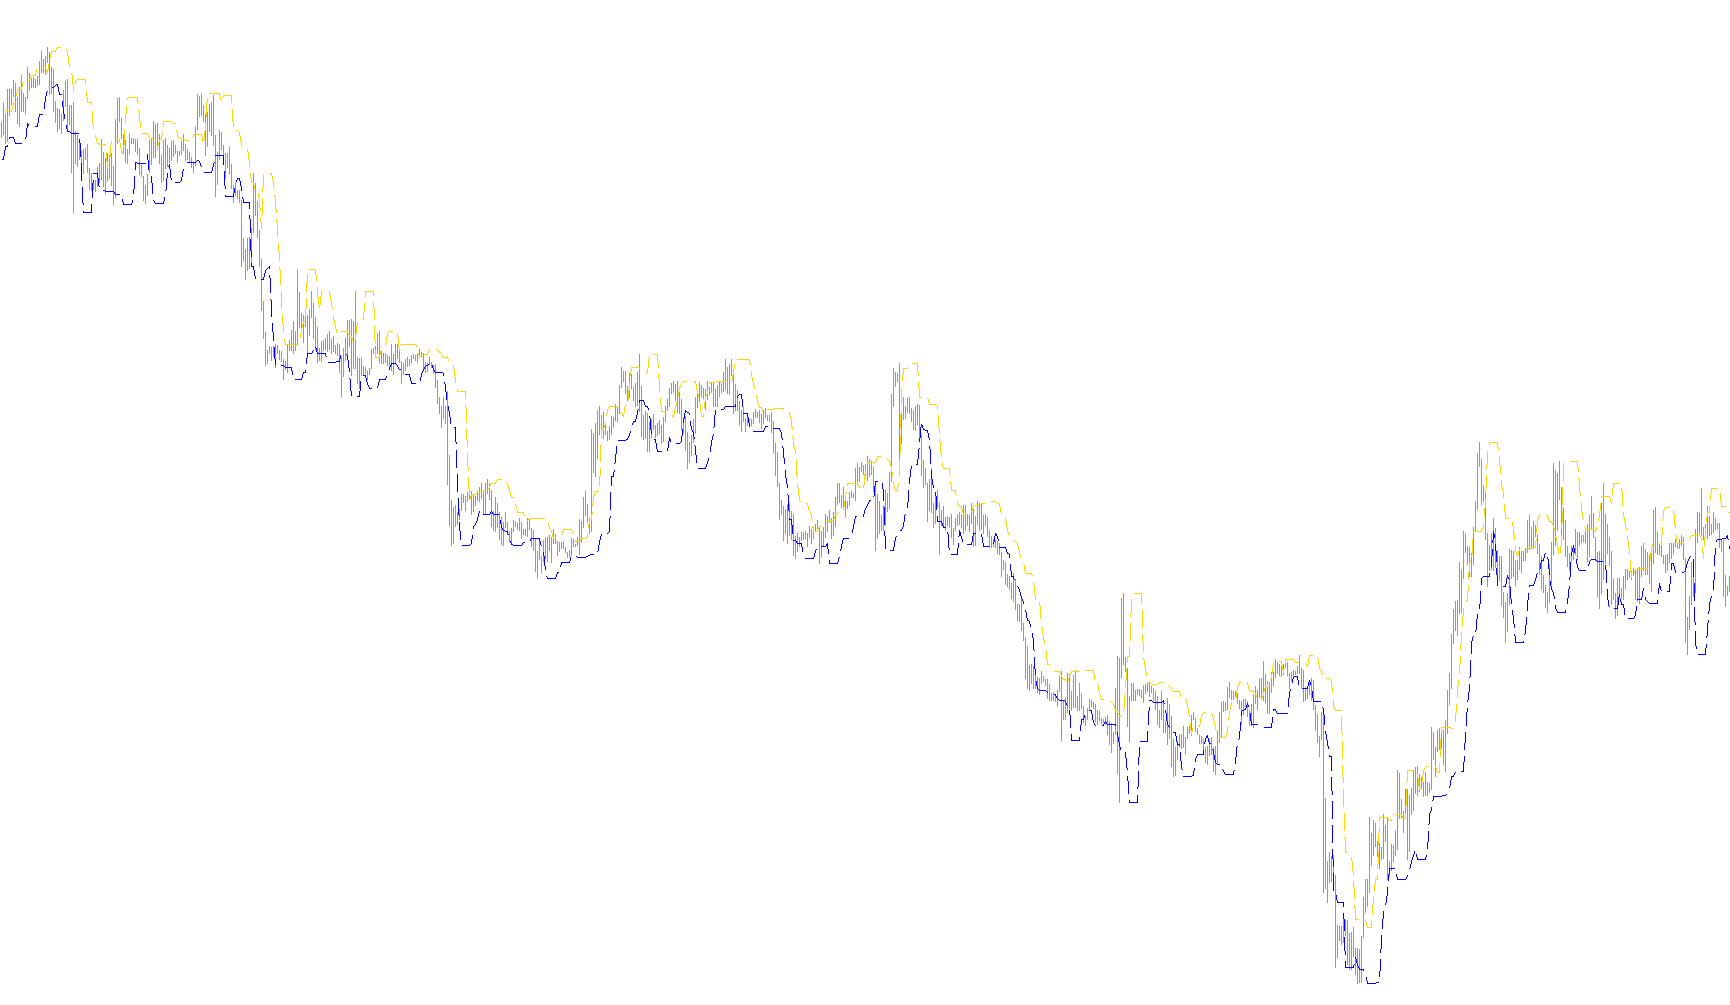
This tool is designed to provide traders with visual price boundaries on their trading charts, specifically functioning as a dynamic "trailing stop" mechanism. It helps identify potential support and resistance levels by analyzing recent price action over a specific look-back period.
How the Logic Works
The script scans historical price data and identifies two distinct price points based on the user-defined "Trail Periods." Here is how it processes the information:
1. The Short Trail Stop (Upper Boundary) The script looks back at a specific number of previous candles (the "Trail Periods"). It identifies the single highest price point reached during that timeframe. It then draws a dashed line on your chart representing this peak. As new candles form, this line follows the price upward, effectively marking a ceiling that represents the recent local high.
2. The Long Trail Stop (Lower Boundary) Simultaneously, the script performs the opposite action for the lower bound. It looks back at the same number of previous candles and identifies the single lowest price point reached. It draws a dashed line representing this valley, marking a floor that follows the price downward as new lows are established.
Key Functionalities for the Trader
- Dynamic Tracking: Because the script constantly recalculates based on the "Trail Periods," these lines move automatically with the market. They are not static; they adapt to the momentum of the current trend.
- Trend Visualization: By observing the space between the two dashed lines, traders can get a clear sense of the current market volatility and the prevailing trend direction.
- Customizable Sensitivity: The logic allows you to choose how many candles the script should "remember." A smaller period will make the lines react quickly to every small price flick, while a larger period will create smoother lines that only react to more significant price movements.
In essence, this script acts as a visual guide, highlighting the extreme boundaries of recent market movement to help traders stay informed about where the price has recently peaked and bottomed out.
/***************************
* File: CandleStop.mq4
* Author: CrushD
***************************/

#property copyright "CrushD"

#property indicator_chart_window
#property indicator_buffers 2
#property indicator_color1 Magenta
#property indicator_color2 Lime

//---- input parameters
extern int TrailPeriods=5;

//---- buffers
double LongTrailBuffer[];
double ShortTrailBuffer[];
//+------------------------------------------------------------------+
//| Custom indicator initialization function                         |
//+------------------------------------------------------------------+
int init()
  {
//---- indicators
   SetIndexStyle(0,DRAW_LINE, STYLE_DASH);
   SetIndexLabel(0, "Short Trail Stop");
   SetIndexBuffer(0,ShortTrailBuffer);
   SetIndexStyle(1,DRAW_LINE, STYLE_DASH);
   SetIndexLabel(1, "Long Trail Stop");
   SetIndexBuffer(1,LongTrailBuffer);
//----
   return(0);
  }
//+------------------------------------------------------------------+
//| Custor indicator deinitialization function                       |
//+------------------------------------------------------------------+
int deinit()
  {
//----

//----
   return(0);
  }
//+------------------------------------------------------------------+
//| Custom indicator iteration function                              |
//+------------------------------------------------------------------+
int start()
  {
   int counted_bars=IndicatorCounted();
   int i;
   if(counted_bars>0) counted_bars--;
   int limit=Bars-counted_bars;

   for(i=0; i<=limit; i++)
   {
      //calc short stop
      //Highest High of last n periods
      ShortTrailBuffer[i] = High[Highest(NULL, 0, MODE_HIGH, TrailPeriods, i+TrailPeriods)];
      //calc long stop
      //Lowest Low of last n periods
      LongTrailBuffer[i] = Low[Lowest(NULL, 0, MODE_LOW, TrailPeriods, i+TrailPeriods)];

   }


//----
   return(0);
  }
//+------------------------------------------------------------------+
Comments