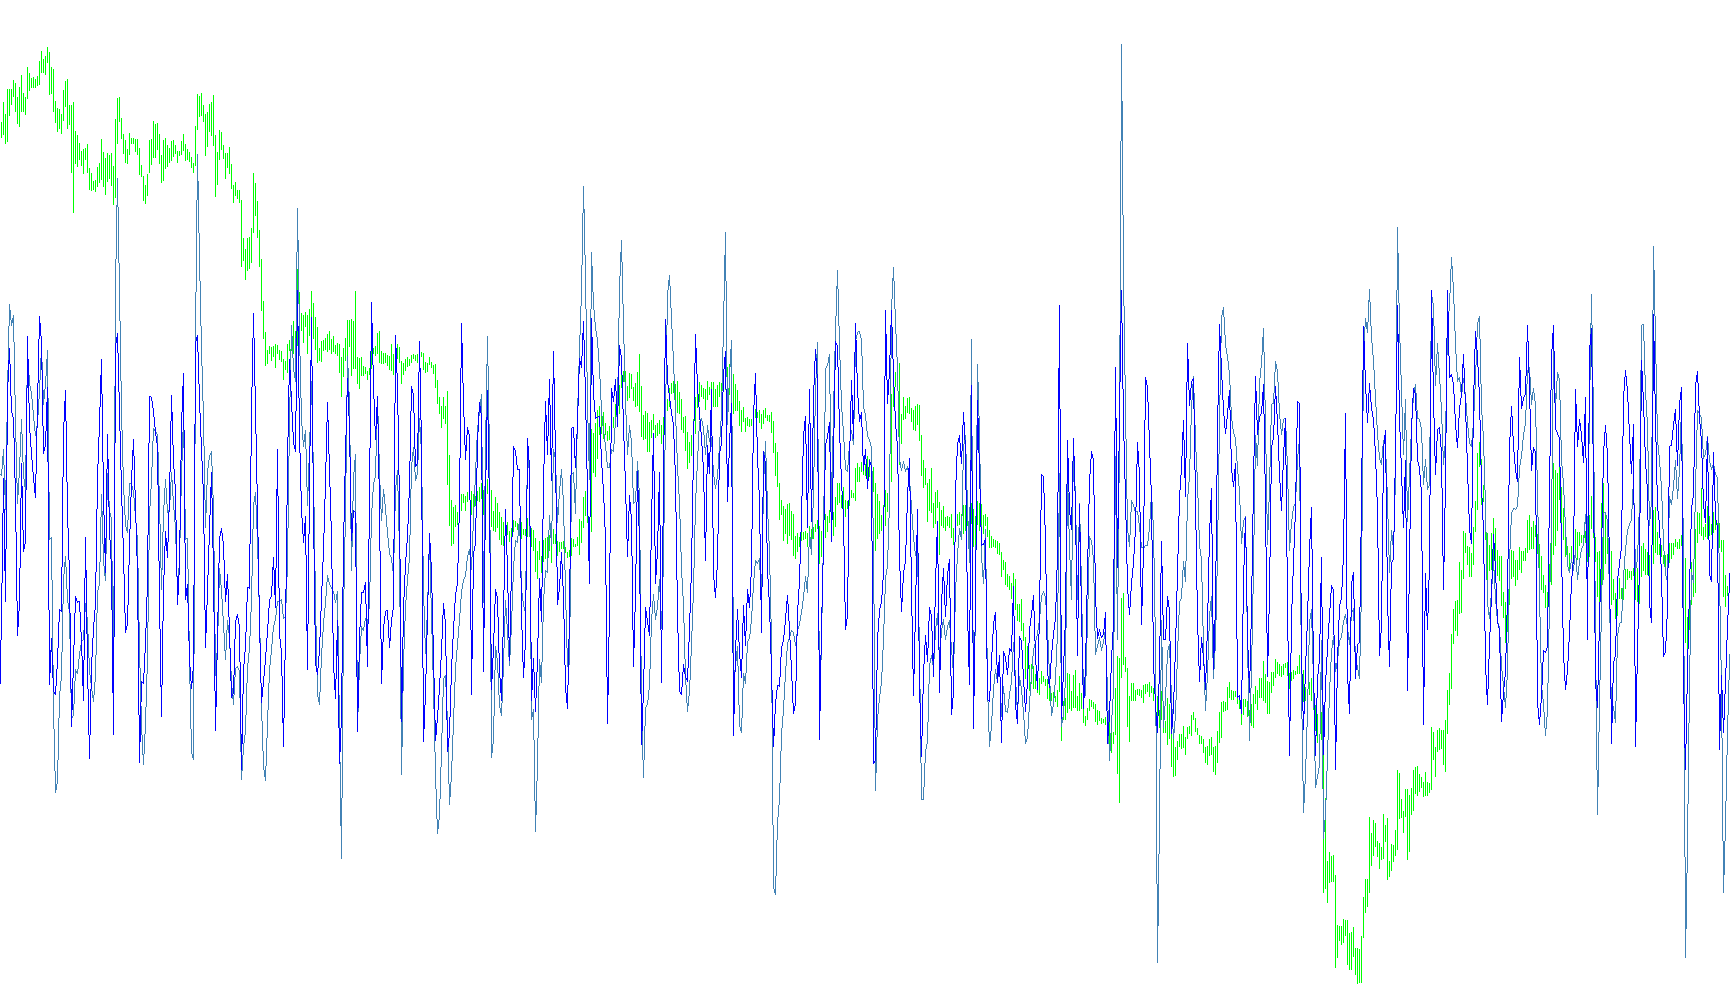
CCI_Woodies_Lnx_v3
Indicator

CCI_Woodies_Lnx_v3

iCCIiMA

This indicator integrates dual Commodity Channel Index (CCI) periods with a custom Linear Scanned Moving Average (LSMA) to visualize trend velocity, transition phases, and momentum shifts through multi-colored histogram layers.

CCI_Woodies_Lnx_v3_1
Indicator

CCI_Woodies_Lnx_v3_1

iCCIiMA

This indicator synthesizes multi-period Commodity Channel Index (CCI) values with a Linear Weighted Moving Average (LSMA) to dynamically visualize trend transitions, exhaustion zones, and momentum shifts through color-coded histograms.

CCI_Woodies_Lnx_v3_1_002
Indicator

CCI_Woodies_Lnx_v3_1_002

iCCIiMA

This indicator synthesizes multi-period Commodity Channel Index (CCI) values with a Linear Scanned Moving Average (LSMA) to visualize trend exhaustion, transition phases, and momentum polarity.

CCI_Woodies_Lnx_v3_1_v1
Indicator

CCI_Woodies_Lnx_v3_1_v1

iCCIiMA

This indicator visualizes multi-layered momentum by categorizing Commodity Channel Index data into directional trend states using a period-based confirmation logic combined with LSMA and EMA filters.

CCI_Woodies_Lnx_v3_1_v2
Indicator

CCI_Woodies_Lnx_v3_1_v2

iCCIiMA

This indicator synthesizes a dual-CCI framework with smoothed LSMA filtering to identify trend structural shifts and momentum transitions via color-coded histogram states.

CCI_Woodies_Lnx_v5
Indicator

CCI_Woodies_Lnx_v5

iCCIiMA

This indicator synchronizes multi-period Commodity Channel Index (CCI) histograms with Linear Scans and Exponential Moving Averages to identify trend shifts and price momentum extremes.

CCI_Woodies_Lnx_v6
Indicator

CCI_Woodies_Lnx_v6

iCCIiMA

This indicator synthesizes Woodie-style logic by overlaying LSMA and EMA filters onto dual CCI periods to identify trend shifts through multi-colored histogram dynamics.

CCI_Woodies_Paterns_v1
Indicator

CCI_Woodies_Paterns_v1

iCCI

This indicator identifies complex trend reversals and continuation opportunities by detecting eight distinct price action patterns—including divergences, line breaks, and volatility hooks—based on the interaction of dual Commodity Channel Index (CCI) oscillators.

CCI_Woodies_v1
Indicator

CCI_Woodies_v1

iCCI

This indicator plots two distinct Commodity Channel Index (CCI) lines with varying periods to visualize divergent price momentum shifts relative to typical price averages.

CCI_Woodies_v2
Indicator

CCI_Woodies_v2

iCCI

This indicator plots two Commodity Channel Index (CCI) lines with different periods, allowing for the identification of potential divergence and convergence patterns.

CCI_Woodies_Valeo
Indicator

CCI_Woodies_Valeo

iCCIiMA

This indicator identifies trend shifts by analyzing the interaction between multiple Commodity Channel Index periods, a weighted LSMA center line, and signal-based histogram color transitions.

Indicator

CCI_Woodie_mtf

iCCIiMA
CCM2
Indicator

CCM2

The indicator quantifies price action dynamics by calculating weighted deviations of candle bodies, upper wicks, and lower wicks relative to standard deviation bands, processed through a sophisticated linear regression filter.

CCM2_001
Indicator

CCM2_001

This indicator quantifies price action intensity by calculating the weighted variance of body sizes and wicks against dynamic volatility bands, processed through a multi-coefficient linear regression.

CCM2_v1
Indicator

CCM2_v1

This indicator utilizes a custom weighted sum of price action dynamics, calculating standard deviation bounds on body-to-wick ratios to generate a smoothed momentum signal.

CCM2_v2
Indicator

CCM2_v2

This indicator quantifies price action by calculating weighted volatility deviations of body, upper shadow, and lower shadow components, then applies a multi-factor linear regression filter to identify structural momentum.

CCM3
Indicator

CCM3

This indicator quantifies market pressure by applying a weighted polynomial decay to candlestick geometry, adjusted via standard deviation bands of price action components.

CCM3_v1
Indicator

CCM3_v1

This indicator calculates a multi-dimensional momentum signal by quantifying price action intensity relative to dynamic volatility bands and applying a weighted decay function over historical candles.

CCM3_v2
Indicator

CCM3_v2

This indicator quantifies market sentiment by mapping price action into a weighted numerical code based on candle body proportions, wick extensions, and volatility bands.

Indicator

CC_at_s_v2

iMA
Indicator

CC_at_s_v2_001

iMA
Indicator

cc_Divergence

iMA
CC_v1
Indicator

CC_v1

iMA

This indicator calculates and visualizes the relative price momentum between major currency pairs by computing the differential of dual moving averages across a multi-currency basket.

cd
Indicator

cd

iMAiMAOnArray

Identifies bullish and bearish reversal points by detecting price crossovers between a dynamic ratio of short-term to long-term EMAs and its smoothed moving average.

CDRW Volume v1.1
Indicator

CDRW Volume v1.1

Categorizes real-time volume flow into expanding, contracting, and neutral states while overlaying a multi-period volumetric mean.

CDRW Volume
Indicator

CDRW Volume

This indicator categorizes market activity into three distinct states by comparing current tick volume against a two-period rolling historical average to identify expansion, contraction, and neutral trends.

CDRW
Indicator

CDRW

Identifies structural supply and demand zones by analyzing divergent relationships between price range expansion, closing body proportion, and relative tick volume.

Center of Gravity 1
Indicator

Center of Gravity 1

iStdDev

This indicator utilizes a Gauss elimination matrix to perform high-order polynomial regression, mapping the underlying price curve and calculating dynamic variance bands for structural trend analysis.

Center Of Gravity Oscillator
Indicator

Center Of Gravity Oscillator

This indicator calculates a momentum value by applying a linear weighting progression to the median or typical price over a specified lookback period.

Center of Gravity
Indicator

Center of Gravity

iStdDev

This indicator employs a Gaussian elimination matrix to calculate the weighted center of gravity of price action, projecting an equilibrium trend line bounded by dynamic standard deviation channels.

Center of Gravity1
Indicator

Center of Gravity1

Calculates a dynamic balance point by determining the ratio of cumulative arithmetic midpoints to weighted temporal positions over a rolling lookback period.

Center of Gravity2
Indicator

Center of Gravity2

This indicator calculates the center of gravity by determining the ratio between the arithmetic mean and the weighted cumulative sum of price midpoints over a specific lookback period.

Center of GravityTrl
Indicator

Center of GravityTrl

iStdDev

This indicator calculates a dynamic price trend by applying a multi-degree polynomial matrix to historical closing prices to determine the weighted geometric center of gravity.

Center of Gravity_001
Indicator

Center of Gravity_001

The algorithm calculates the weighted mean price by aggregating mid-point values relative to their temporal distance from the current candle within a specified period.

Center of Gravity_002
Indicator

Center of Gravity_002

This indicator calculates a momentum-based center of gravity by determining the ratio between the arithmetic mean of price midpoints and their weighted positional averages over a specific period.

center of gravity_v1
Indicator

center of gravity_v1

This indicator calculates a dynamic price pivot by determining the ratio between the cumulative average of mid-point prices and their weighted linear distribution over a specific lookback period.

Center of Gravity_v3
Indicator

Center of Gravity_v3

iStdDev

This indicator calculates a dynamic price trajectory by applying Gaussian elimination to solve for polynomial coefficients, establishing a statistical equilibrium path and its associated standard deviation envelopes.

CenterofGravityalerttoughprice2
Indicator

CenterofGravityalerttoughprice2

iStdDev

This indicator utilizes Gaussian elimination to solve a system of linear equations, modeling price action as a polynomial curve to determine the structural center of gravity and its associated standard deviation boundaries.

Center_Of_Gravity
Indicator

Center_Of_Gravity

iStdDev

This indicator utilizes a Gaussian elimination matrix to solve for polynomial coefficients of historical price action, constructing a smoothed trend line with dynamic standard deviation bands.

Center_of_Gravityind
Indicator

Center_of_Gravityind

iMAiMAOnArray

This indicator calculates the relative balance of price momentum by weighing historical price points against their moving averages to identify divergence and mean reversion.

CFD v1.0
Indicator

CFD v1.0

This script systematically probes the broker's server to identify and populate an array of all tradable assets by iterating through multi-character alphanumeric combinations.

CFP-1
Indicator

CFP-1

iMA

This indicator aggregates weighted moving average discrepancies across multiple currency pairs to derive a unified momentum flux for a specific base currency.

Indicator

CFP

iMA
CG
Indicator

CG

Calculates a weighted average position of price midpoints to determine cyclic momentum and trend exhaustion through a zero-centered oscillator.

Chaikin's Volatility (2 lines)
Indicator

Chaikin's Volatility (2 lines)

iMAOnArray

This indicator calculates the percentage rate of change between dual smoothed exponential moving averages of price range expansion to identify momentum shifts.

Chaikin's Volatility (2 lines)_v2
Indicator

Chaikin's Volatility (2 lines)_v2

iMAOnArray

This indicator measures relative price expansion by calculating the percentage divergence between fast and slow exponential moving averages of the bar range.

Chaikin's Volatility StochasticM2
Indicator

Chaikin's Volatility StochasticM2

iMAOnArray

This indicator calculates a smoothed stochastic percentage based on the exponential moving average of price range fluctuations to identify momentum within volatility shifts.

Chaikin's Volatility(1)
Indicator

Chaikin's Volatility(1)

iMAOnArray

This indicator calculates the percentage rate of change between the Exponential Moving Average of price ranges over specific lookback periods.

Chaikin's Volatility_v1
Indicator

Chaikin's Volatility_v1

iMAOnArray

This indicator quantifies the relative rate of change in price range expansion by calculating the percentage deviation of an exponential moving average of high-low differentials over a specific lookback period.

Chaikin's Volatility_v2
Indicator

Chaikin's Volatility_v2

iMAOnArray

This indicator quantifies relative price range expansion by calculating the percentage rate of change between exponential moving averages of high-low spreads.