Cams_Daily_Rev
Download script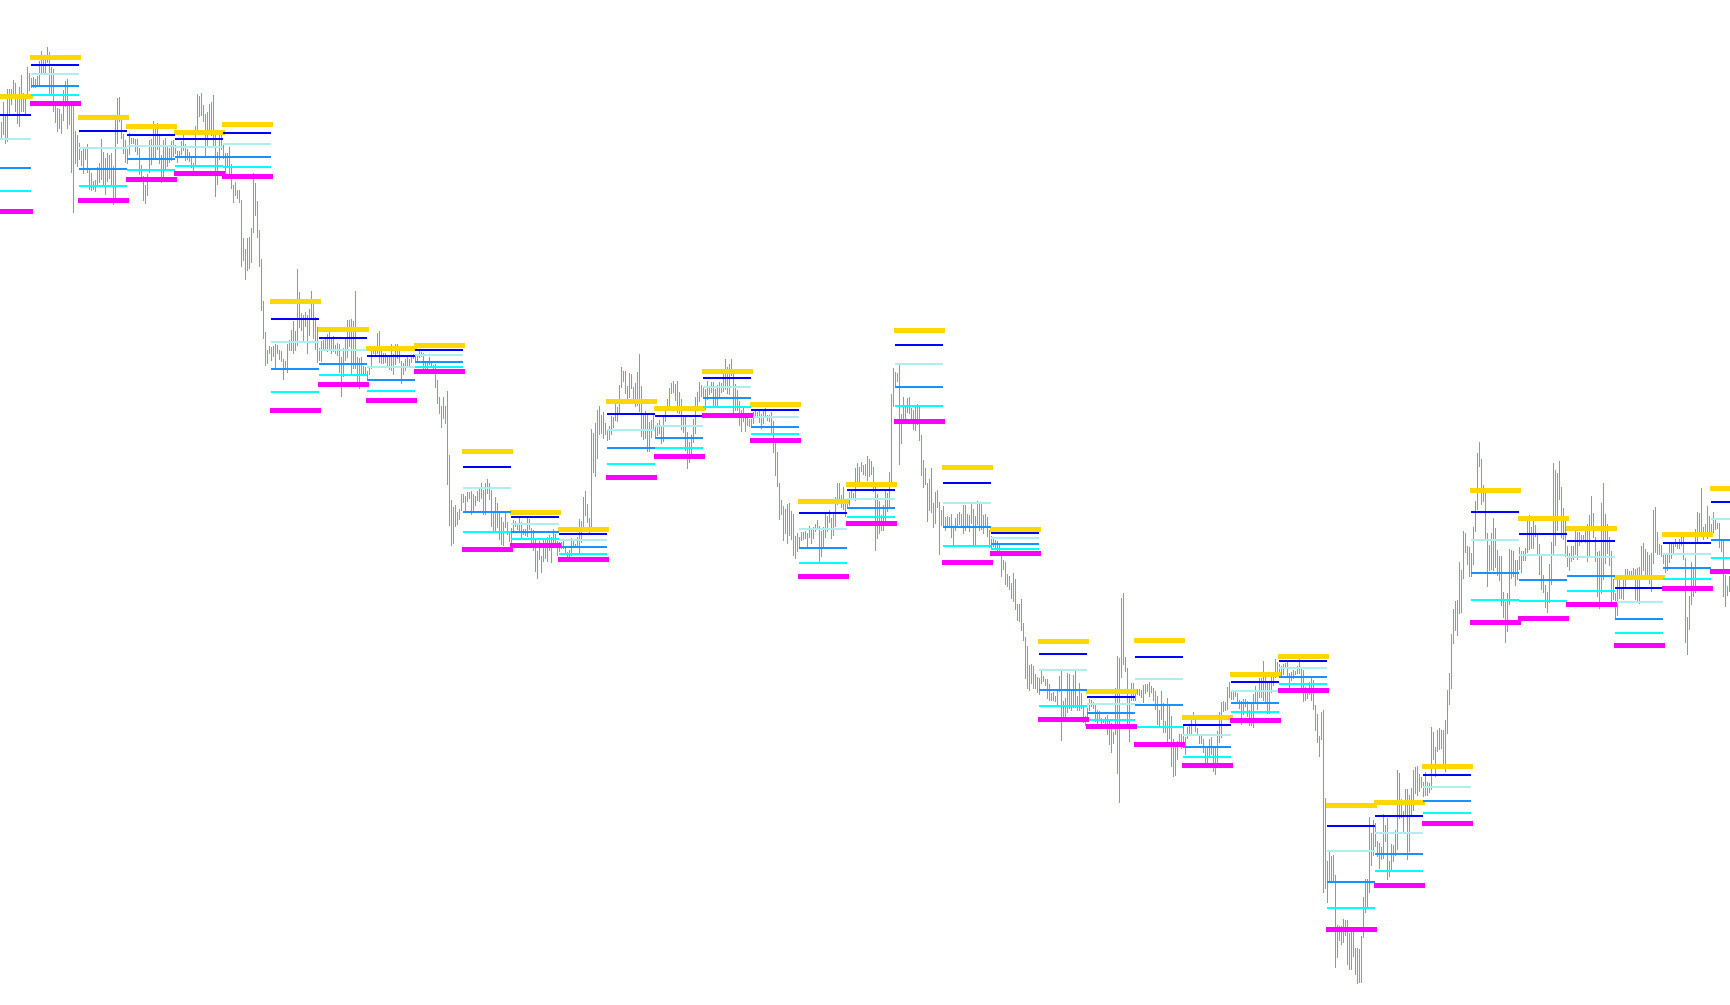
This script is a specialized technical analysis tool designed to automatically calculate and display specific price levels known as Camarilla Pivot Points on your trading chart. These levels are widely used by traders to identify potential support and resistance zones based on the price action of previous trading sessions.
Core Functionality
The primary purpose of this script is to take historical price data—specifically the highest and lowest prices reached, along with the closing price of a preceding period—and use them to project six key levels: three "High" (H1, H2, H3) levels and three "Low" (L1, L2, L3) levels.
How the Logic Works
The script follows a structured process to ensure these levels are calculated accurately and updated in real-time:
- Time Tracking and Detection: The tool monitors the passage of time on your chart. It identifies specific "Pivot" windows (based on user-defined start and end times) to determine when a new trading session begins. This allows it to distinguish between price action from the current period and the completed historical data needed for calculations.
- Data Extraction: Once a required time period is identified, the script automatically scans that specific timeframe to find three critical pieces of information:
- The Highest Price reached during that period.
- The Lowest Price reached during that period.
- The Closing Price at the end of that period.
- Mathematical Calculation: The script then applies the Camarilla formula to these three values. It calculates the difference between the High and Low (the "range") and uses specific fractions (1/4, 1/6, and 1/16) relative to the closing price to derive the six distinct pivot levels.
- Visual Rendering: Finally, the script translates these mathematical results into visual markers on your chart. It draws arrows at the calculated prices so you can see where these key zones are located at a glance. Specifically, it highlights the H3 and L3 levels—which are often considered significant turning points in market psychology—while providing the framework for the other interior levels.
User Experience
For the end user, this means you no longer have to manually calculate complex price ratios. The script handles the heavy lifting of scanning historical data, performing the arithmetic, and placing the visual markers on your screen automatically as new candles form and time periods transition.
//+------------------------------------------------------------------+
//|                                               Cams_Daily_Rev.mq4 |
//|            Original Pivot Framework sourced from Forex-TSD Forum |
//|                                adapted by kris.pivo[at]gmail.com |
//+------------------------------------------------------------------+
#property copyright "© Kris, 2008"                                 //|
//+------------------------------------------------------------------+
#property indicator_chart_window
#property indicator_buffers 6
#property indicator_color1 C'255,000,000'
#property indicator_color2 C'000,150,000'
#property indicator_color3 C'150,000,000'
#property indicator_color4 C'000,150,000'
#property indicator_color5 C'150,000,000'
#property indicator_color6 C'000,255,000'

//Input Params
extern string PivotStart = "00:00";
extern string PivotEnd   = "00:00";

double Buffer0[]; // Cam H3
double Buffer1[]; // Cam H2
double Buffer2[]; // Cam H1
double Buffer3[]; // Cam L1
double Buffer4[]; // Cam L2
double Buffer5[]; // Cam L3

double LastHigh,LastLow,LastClose;
double CamH3, CamH2, CamH1, CamL1, CamL2, CamL3;

int OpenBar;

int init()
{  SetIndexStyle(0,DRAW_ARROW);
   SetIndexArrow(0,167);
   SetIndexBuffer(0,Buffer0);
   SetIndexLabel(0,"Camarilla H3");

   SetIndexStyle(1,DRAW_ARROW);
   SetIndexArrow(1,160);
   SetIndexBuffer(1,Buffer1);
   SetIndexLabel(1,"Camarilla H2");

   SetIndexStyle(2,DRAW_ARROW);
   SetIndexArrow(2,160);
   SetIndexBuffer(2,Buffer2);
   SetIndexLabel(2,"Camarilla H1");

   SetIndexStyle(3,DRAW_ARROW);
   SetIndexArrow(3,160);
   SetIndexBuffer(3,Buffer3);
   SetIndexLabel(3,"Camarilla L1");

   SetIndexStyle(4,DRAW_ARROW);
   SetIndexArrow(4,160);
   SetIndexBuffer(4,Buffer4);
   SetIndexLabel(4,"Camarilla L2");

   SetIndexStyle(5,DRAW_ARROW);
   SetIndexArrow(5,167);
   SetIndexBuffer(5,Buffer5);
   SetIndexLabel(5,"Camarilla L3");

   return(0); }

int deinit() {
	ObjectDelete("H3"); ObjectDelete("CH3");
	ObjectDelete("H2");
	ObjectDelete("H1");
	ObjectDelete("L1");
	ObjectDelete("L2");
	ObjectDelete("L3"); ObjectDelete("CL3");
	Comment("");
	return(0);
}

int start()
{  string BarTime="", LastBarTime="";
   string BarDay="", LastBarDay="";
   int CloseBar;

   for(int i=Bars; i>=0; i--)
   {  BarTime = TimeToStr(Time[i], TIME_MINUTES);
      LastBarTime = TimeToStr(Time[i+1], TIME_MINUTES);
      BarDay = TimeToStr(Time[i],TIME_DATE);
      LastBarDay = TimeToStr(Time[i+1],TIME_DATE);

      //need to handle if pivotrangestart/end is 00:00
      if ((PivotEnd == "00:00" && BarTime>=PivotEnd && BarDay>LastBarDay) || (BarTime>=PivotEnd && LastBarTime<PivotEnd))
      {  CloseBar = i + 1;

         if (OpenBar>0)
         {  calculatePivotRangeValues(OpenBar, CloseBar);  }  }

      if ((PivotStart == "00:00" && BarTime>=PivotStart && BarDay>LastBarDay) || (BarTime>=PivotStart && LastBarTime<PivotStart))
      { OpenBar = i; }

      if (OpenBar>0)
      { drawIndicators(i);  } }
   return(0);}
void calculatePivotRangeValues(int openBar, int closeBar)
   {
   LastHigh = High[Highest(NULL, 0, MODE_HIGH, (openBar - closeBar + 1), closeBar)];
   LastLow = Low[Lowest(NULL, 0, MODE_LOW, (openBar - closeBar + 1), closeBar)];
   LastClose = Close[closeBar];

	CamH3 = LastClose + (LastHigh - LastLow) * 1/4;
	CamH2 = LastClose + (LastHigh - LastLow) * 1/6;
	CamH1 = LastClose + (LastHigh - LastLow) * 1/16;
	CamL1 = LastClose - (LastHigh - LastLow) * 1/16;
	CamL2 = LastClose - (LastHigh - LastLow) * 1/6;
	CamL3 = LastClose - (LastHigh - LastLow) * 1/4;
   }

void drawIndicators(int curBar)
{
   Buffer0[curBar]=CamH3;
   Buffer1[curBar]=CamH2;
   Buffer2[curBar]=CamH1;
   Buffer3[curBar]=CamL1;
   Buffer4[curBar]=CamL2;
   Buffer5[curBar]=CamL3;

   DoLabel( "CH3", Buffer0[0], indicator_color1 ) ;
// DoLabel( "CH2", Buffer1[0], indicator_color2 ) ;
// DoLabel( "CH1", Buffer2[0], indicator_color3 ) ;
// DoLabel( "CL1", Buffer3[0], indicator_color4 ) ;
// DoLabel( "CL2", Buffer4[0], indicator_color5 ) ;
   DoLabel( "CL3", Buffer5[0], indicator_color6 ) ;
	return(0); }

void DoLabel( string dName, double dValue, color dColor )
   {
   if (ObjectFind(dName) != 0)
      {
      ObjectCreate(dName,OBJ_ARROW,0,Time[0],dValue);
      ObjectSet(dName,OBJPROP_ARROWCODE,SYMBOL_RIGHTPRICE);
      ObjectSet(dName,OBJPROP_COLOR,dColor);
      }
   else
      {
      ObjectMove(dName,0,Time[0],dValue);
      }
   }
//+-----------------------------------------------------------------------------------------+
//|                                         THE END                                         |
//+-----------------------------------------------------------------------------------------+
Comments