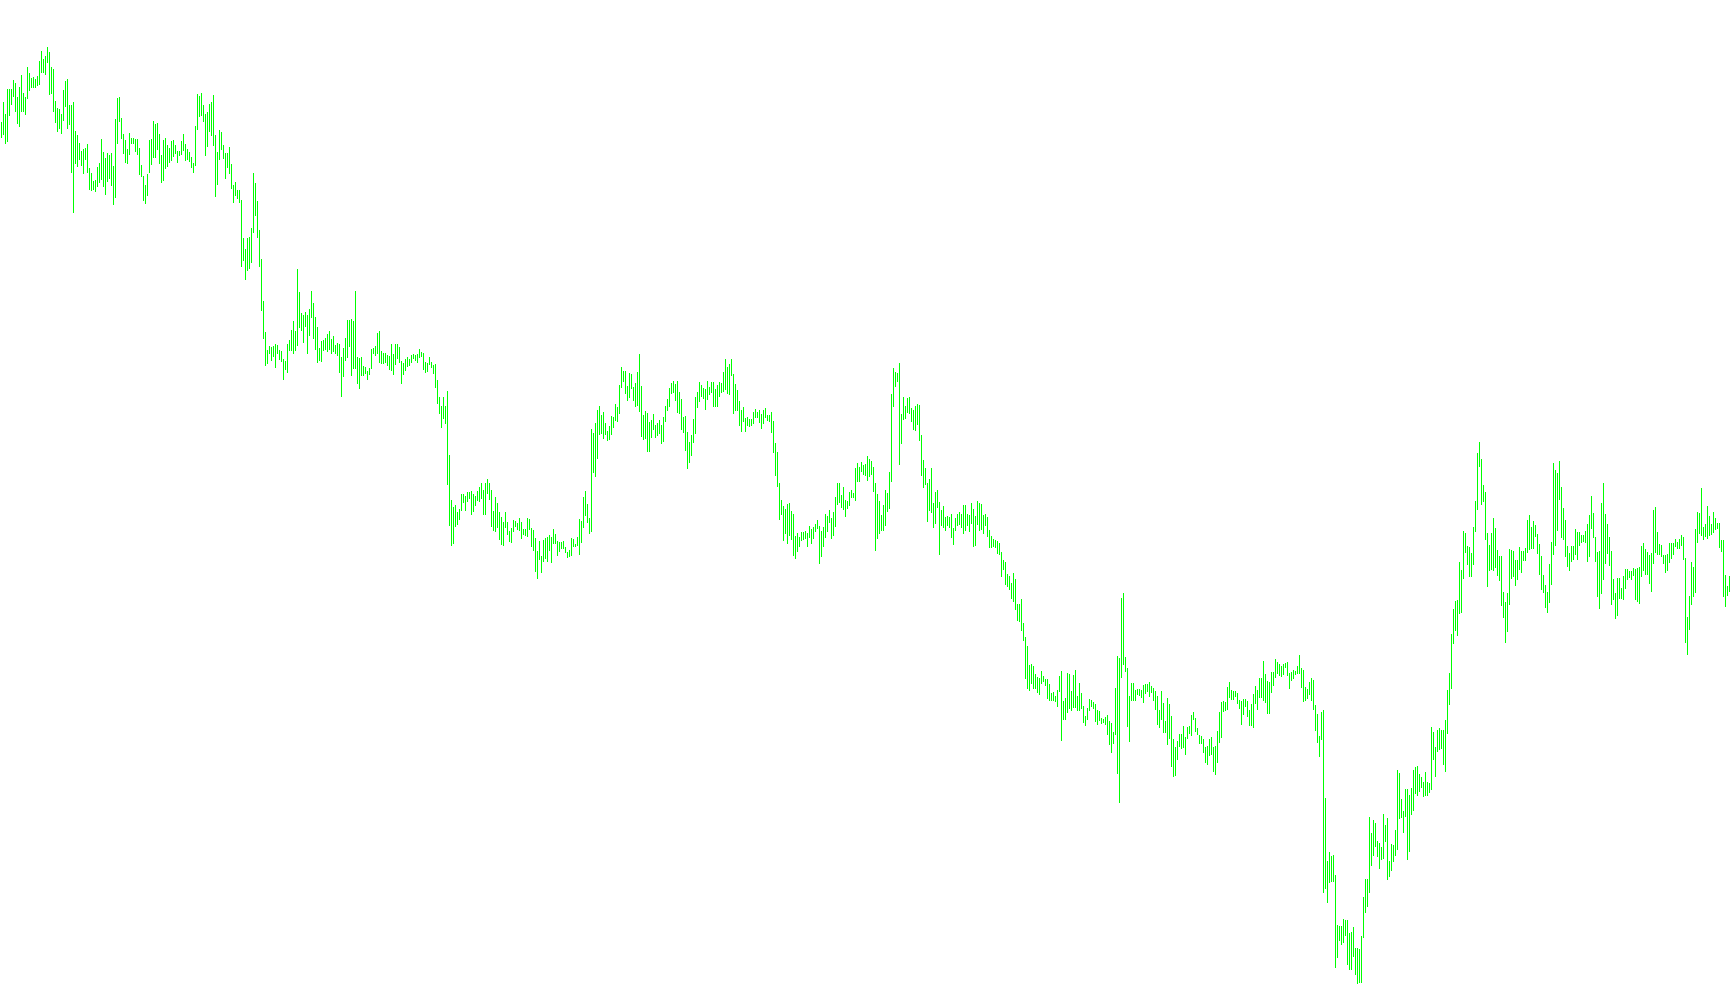
This script is designed to automatically calculate and visualize specific historical price levels on your trading chart. Specifically, it focuses on identifying "Camarilla Pivots," which are key price points used by traders to identify potential support and resistance levels based on the previous day's market activity.
Core Functionality
The primary purpose of this tool is to look at the high, low, and closing prices of a completed trading day and project four specific levels (labeled L2, L3, L4, and L5) onto the current chart. These lines help traders visualize where the market might encounter friction or reversal points during the current session.
How the Logic Works
To provide these visuals, the script performs several automated steps:
- Data Collection: The tool scans backward through historical price data to determine the highest and lowest prices reached during the previous trading day, as well as the final closing price.
- Mathematical Calculation: Using those three key values (High, Low, and Close), the script applies specific mathematical formulas to derive four distinct price levels:
- L2, L3, and L4: These are calculated based on the range of the previous day's movement. They represent different proportions of that range relative to the closing price.
- L5: This is calculated using a unique formula involving the ratio between the high and low prices to determine a deeper pivot point.
- Historical Mapping: The script doesn't just show today's levels; it populates the chart with these lines for previous days (up to a user-defined limit), allowing you to see how these pivots behaved in the past.
User Interface Features
To make the data easy to read, the script includes several automated visual aids:
- Dynamic Labeling: The tool automatically places text labels on the right side of the chart. These labels identify each line (L2 through L5) and display the exact numerical price at that level.
- Real-Time Tracking: It draws horizontal "trend" lines for the current day’s pivots, which move in real-time as new data comes in.
- Customization: Users can toggle the visibility of specific levels (such as choosing to see only L2) and adjust visual settings like line color, font size, and how far back into the past the history should be drawn.
Operational Constraints
For the logic to function accurately, the script includes a safety check: it will notify the user if the chart timeframe is set too large (greater than 4 hours), as the Camarilla calculations are specifically calibrated for intraday movements.
//+------------------------------------------------------------------+
//|                                      cam_L2_L5_Historical_V4.mq4 |
//|                      Copyright © 2005, MetaQuotes Software Corp. |
//|                                        http://www.metaquotes.net |
//| Modified to chart historical camarilla pivots by MrPip           |
//| 3/28/06 Fixed problem of Sunday/Monday pivots                    |
//|         and added some ideas from goodtiding5 (Kenneth Z.)       |
//+------------------------------------------------------------------+
#property copyright "Copyright © 2005, MetaQuotes Software Corp."
#property link      "http://www.metaquotes.net"

#property indicator_chart_window
#property indicator_buffers 4
#property indicator_color1 Red
#property indicator_color2 Red
#property indicator_color3 Red
#property indicator_color4 Red
#property indicator_width1 1
#property indicator_width2 1
#property indicator_width3 1
#property indicator_width4 1
#property indicator_style1 STYLE_DASHDOTDOT
#property indicator_style2 STYLE_DASHDOTDOT
#property indicator_style3 STYLE_DASHDOTDOT
#property indicator_style4 STYLE_DASHDOTDOT

//---- input parameters

extern int  GMTshift=0;
extern color LColor = Red;
extern int fontsize=8;
extern int LabelShift=11;
extern int DaysDrawBack=15;
extern bool DisplayL2 = true;
extern bool DisplayCurrentLines = true;

double L2Buffer[];
double L3Buffer[];
double L4Buffer[];
double L5Buffer[];

double L2, L3, L4, L5;

double D1=0.091667;
double D2=0.183333;
double D3=0.2750;
double D4=0.55;

double prev_high=0;
double prev_low=0;
double prev_close=0;
double cur_day=0;
double prev_day=0;
double day_high=0;
double day_low=0;

//+------------------------------------------------------------------+
//| Custom indicator initialization function                         |
//+------------------------------------------------------------------+
int init()
  {
   IndicatorBuffers(4);
//---- indicators
   SetIndexStyle(0,DRAW_LINE, STYLE_DASHDOTDOT);
   SetIndexBuffer(0,L2Buffer);
   SetIndexStyle(1,DRAW_LINE, STYLE_DASHDOTDOT);
   SetIndexBuffer(1,L3Buffer);
   SetIndexStyle(2,DRAW_LINE, STYLE_DASHDOTDOT);
   SetIndexBuffer(2,L4Buffer);
   SetIndexStyle(3,DRAW_LINE, STYLE_DASHDOTDOT);
   SetIndexBuffer(3,L5Buffer);

   SetIndexLabel(0,"L2");
   SetIndexLabel(1,"L3");
   SetIndexLabel(2,"L4");
   SetIndexLabel(3,"L5");

//----
//   IndicatorShortName("Cam Pivots");
//----
   return(0);
  }
//+------------------------------------------------------------------+
//| Custor indicator deinitialization function                       |
//+------------------------------------------------------------------+
int deinit()
  {
//---- TODO: add your code here
   ObjectDelete("SupL2");
   ObjectDelete("SupL3");
   ObjectDelete("SupL4");
   ObjectDelete("SupL5");
   ObjectDelete("SupL2Line");
   ObjectDelete("SupL3Line");
   ObjectDelete("SupL4Line");
   ObjectDelete("SupL5Line");
//----
   return(0);
  }

//+------------------------------------------------------------------+
//| Custom indicator iteration function                              |
//+------------------------------------------------------------------+
int start()
  {
   int    counted_bars=IndicatorCounted();
   int cnt, limit;

//---- exit if period is greater than 4 hr charts
   if(Period() > 240)
   {
      Alert("Error - Chart period is greater than 4 Hr.");
      return(-1); // then exit
   }
   if(counted_bars<0) return(-1);

//---- last counted bar will be recounted
//   if(counted_bars>0) counted_bars--;

//   limit=(Bars-counted_bars)-1;
   if (counted_bars > DaysDrawBack*1440/Period()) counted_bars = DaysDrawBack*1440/Period();
   limit=counted_bars;

//---- Get new daily prices & calculate pivots

   for (cnt=limit;cnt >=0;cnt--)
   {
   	if (TimeDayOfWeek(Time[cnt]) == 0)
	   {
        cur_day = prev_day;
	   }
	   else
	   {
        cur_day = TimeDay(Time[cnt]- (GMTshift*3600));
	   }

   	if (prev_day != cur_day)
   	{
	   	prev_close = Close[cnt+1];
		   prev_high = day_high;
		   prev_low = day_low;

	      day_high = High[cnt];
 	      day_low  = Low[cnt];


//L1 = prev_close - ((prev_high - prev_low)*(D1));
L2 = prev_close - ((prev_high - prev_low)*(D2));
L3 = prev_close - ((prev_high - prev_low)*(D3));
L4 = prev_close - ((prev_high - prev_low)*(D4));
L5 = prev_close - ((prev_high/prev_low)*prev_close - prev_close);

		   prev_day = cur_day;
	   }
      if (High[cnt]>day_high)
      {
         day_high = High[cnt];
      }
      if (Low[cnt]<day_low)
      {
         day_low = Low[cnt];
      }


//         day_low=Open[cnt]; day_high=Open[cnt];


//---  Draw  Pivot lines on chart

      if (DisplayL2) L2Buffer[cnt]=L2;
      L2Buffer[cnt]=L2;
      L3Buffer[cnt]=L3;
      L4Buffer[cnt]=L4;
      L5Buffer[cnt]=L5;

   }

   if (cur_day == TimeDay(CurTime()))   DisplayLabels();
//----
   return(0);
  }

void DisplayLabels( )
{

     if (DisplayL2)
     {
        SetLabel("SupL2", "L 2", L2, LColor, LabelShift);
     }

     SetLabel("SupL3", "L 3", L3, LColor, LabelShift);
     SetLabel("SupL4", "L 4", L4, LColor, LabelShift);
     SetLabel("SupL5", "L 5", L5, LColor, LabelShift);

// Display Current Lines

     if (DisplayCurrentLines)
     {
      if (DisplayL2)
      {
        SetLine("SupL2Line", L2, LColor );
      }
      SetLine("SupL3Line", L3, LColor );
      SetLine("SupL4Line", L4, LColor );
      SetLine("SupL5Line", L5, LColor );
     }
}


// put a label on the line
void SetLabel(string textname, string text, double level, color col1, int LabelShift)
{
   double myLevel;
   int digits = MarketInfo(Symbol(), MODE_DIGITS);
   myLevel = NormalizeDouble(level, digits);

      if(ObjectFind(textname) != 0)
      {
      ObjectCreate(textname, OBJ_TEXT, 0, Time[LabelShift], myLevel);
      ObjectSetText(textname, "                                                 " + text + "   " + DoubleToStr(myLevel, digits), fontsize,"Arial",col1);
      }
      else
      {
         ObjectSetText(textname, "                                                 " + text + "   " + DoubleToStr(myLevel, digits), fontsize,"Arial",col1);
         ObjectMove(textname, 0, Time[LabelShift],myLevel);
      }
}

// create or move the horizontal line
void SetLine(string linename, double level, color col1 )
{

      if(ObjectFind(linename) != 0)
      {
      ObjectCreate(linename, OBJ_TREND, 0, Time[1], level, Time[0], level);
      ObjectSet(linename, OBJPROP_STYLE, STYLE_DASHDOTDOT);
      ObjectSet(linename, OBJPROP_COLOR, col1);
      ObjectSet(linename, OBJPROP_WIDTH, 1);
      }
      else
      {
      ObjectMove(linename, 1, Time[0], level);
      ObjectMove(linename, 0, Time[1], level);
      }

}

//+------------------------------------------------------------------+
Comments