renkotimev2ma
Download script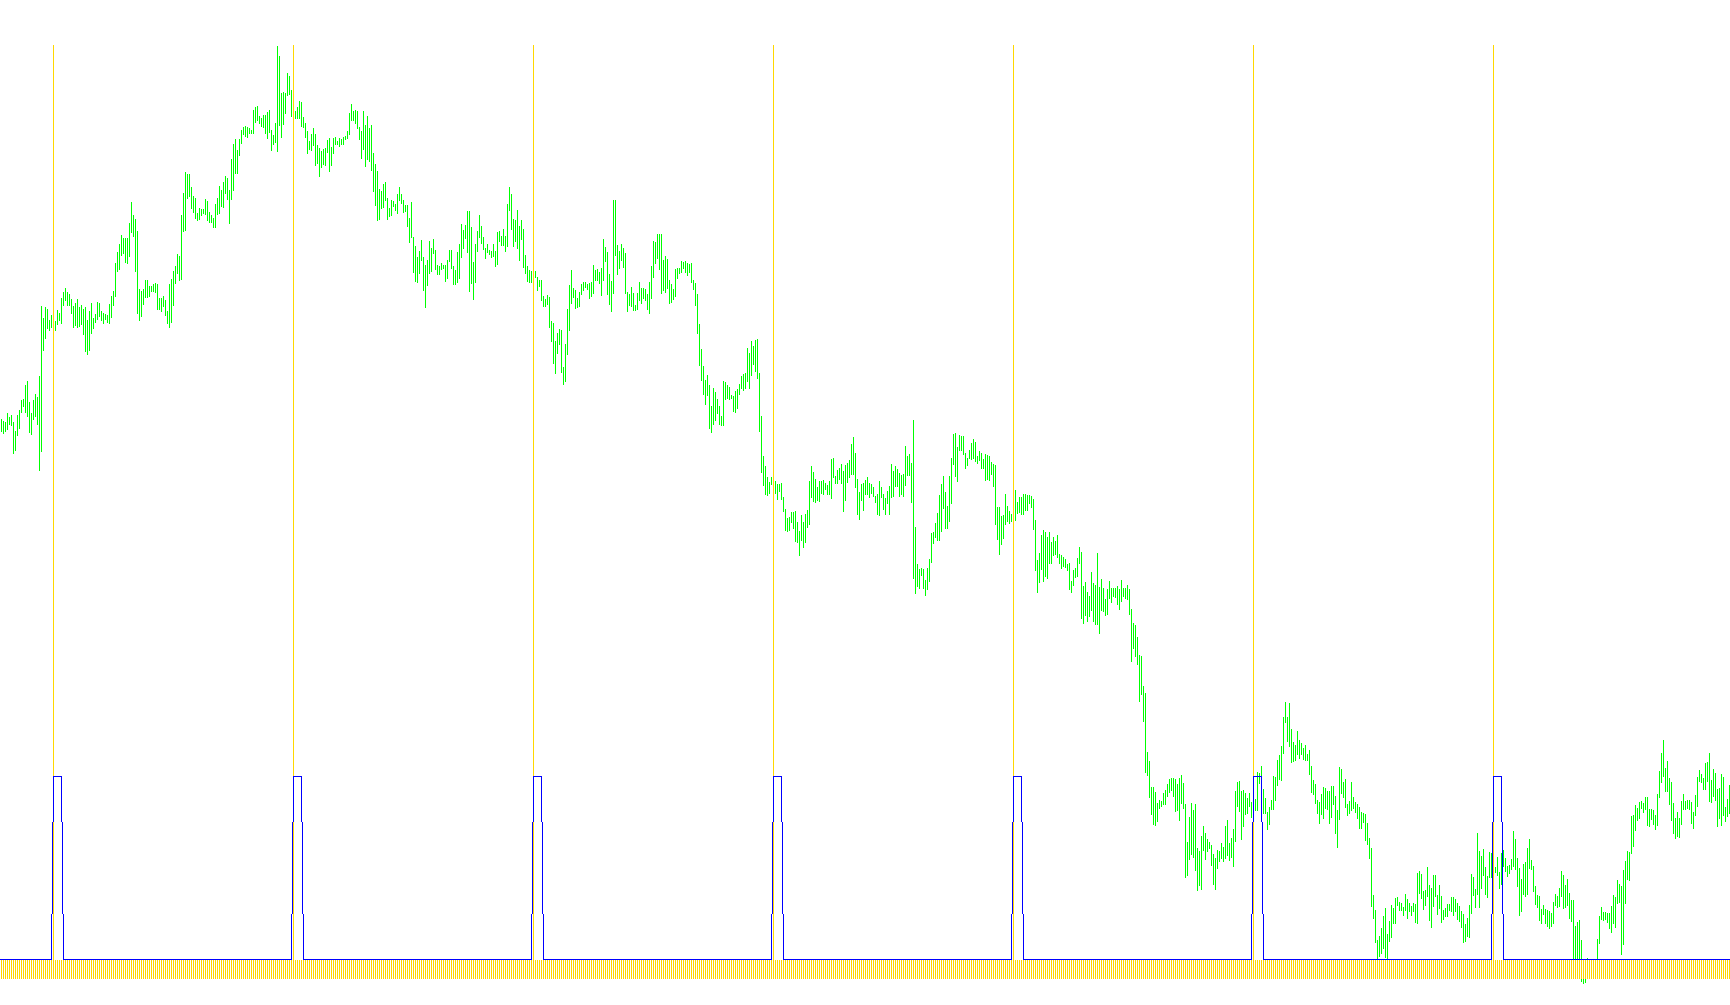
This tool is designed to measure and visualize the amount of time that passes between consecutive price movements (specifically Renko bricks or blocks) on your trading chart. Instead of looking at price fluctuations, this indicator focuses entirely on "time velocity."
How it Works
The core logic of the script functions by calculating the duration of each individual block in seconds. It looks at the timestamp of a previous block and compares it to the timestamp of the next one to determine exactly how much time elapsed between those two events.
By converting price movements into a timeline of seconds, the tool provides several key insights:
- Time Spacing: It tracks whether blocks are forming in rapid succession or if there are long periods of "waiting" where no new bricks are created.
- Historical Trends: The indicator creates a visual history of these time intervals, allowing you to see how the speed of price action has changed over the past several hours or days.
- Smoothing and Averages: To make the data easier to read, the script includes a Moving Average feature. This smooths out the "noise" of individual second counts to show you the broader trend of time flow—helping you identify if the market is currently accelerating or slowing down.
Visual Representation
The tool displays this data in a separate window below your main price chart:
- The Histogram: Represents the specific number of seconds between each block. Tall bars indicate a long delay between movements, while short bars indicate rapid-fire price action.
- The Moving Average Line: Provides a smoothed representation of those time intervals, making it easier to spot consistent shifts in market rhythm.
Essentially, this script acts as a "speedometer" for your Renko chart, letting you see how quickly the market is moving through price levels rather than just looking at the price itself.
//--- Renko Time Indicator - time difference between candles / bricks / blocks
#property copyright "Copyright 2015, Paul Reed."
#property version   "2.00"
#property strict
#property indicator_separate_window
#property indicator_buffers 2
#property indicator_color1  Blue
#property indicator_width1  2
#property indicator_color2  Red
#property indicator_width2  1
#property indicator_minimum 0 // Set indicator fixed min is 0
double timebuffer[]; // Buffer to hold the array of time differences
double MAbuffer[];
extern int MAtype=0;
extern int MAperiod=5;
//+------------------------------------------------------------------+
//|                                                                  |
//+------------------------------------------------------------------+
int OnInit(void)
  {
   IndicatorDigits(0); // We don't need to display fractions of a second!
   SetIndexStyle(0,DRAW_HISTOGRAM);
   SetIndexBuffer(0,timebuffer);
   SetIndexStyle(1,DRAW_LINE);
   SetIndexBuffer(1,MAbuffer);
   IndicatorShortName("RenkoTime v 2.0 MA");
   SetIndexLabel(0,"Seconds");
   SetIndexLabel(1,"MA Seconds");

   return(INIT_SUCCEEDED);
  }
//+------------------------------------------------------------------+
//|                                                                  |
//+------------------------------------------------------------------+
int OnCalculate(const int rates_total,
                const int prev_calculated,
                const datetime &time[],
                const double &open[],
                const double &high[],
                const double &low[],
                const double &close[],
                const long &tick_volume[],
                const long &volume[],
                const int &spread[])
  {
   int i,limit;
   limit=rates_total-prev_calculated; // Set limit to the number of candles
   if(prev_calculated>0) limit++;

   for(i=1; i<limit; i++) // For each candle...
     {
      timebuffer[i]=(double)(time[i-1]-time[i]); // Calculate time difference and put in buffer
     }

   timebuffer[0]=(double)(TimeCurrent()-time[0]); // Calculate last bar from the current time

   for(i=0; i<limit; i++) // For each candle...
     {
      MAbuffer[i]=iMAOnArray(timebuffer,0,MAperiod,0,MAtype,i);
     }

   return(rates_total);
  }
//+------------------------------------------------------------------+
Comments