SAR Color
Download script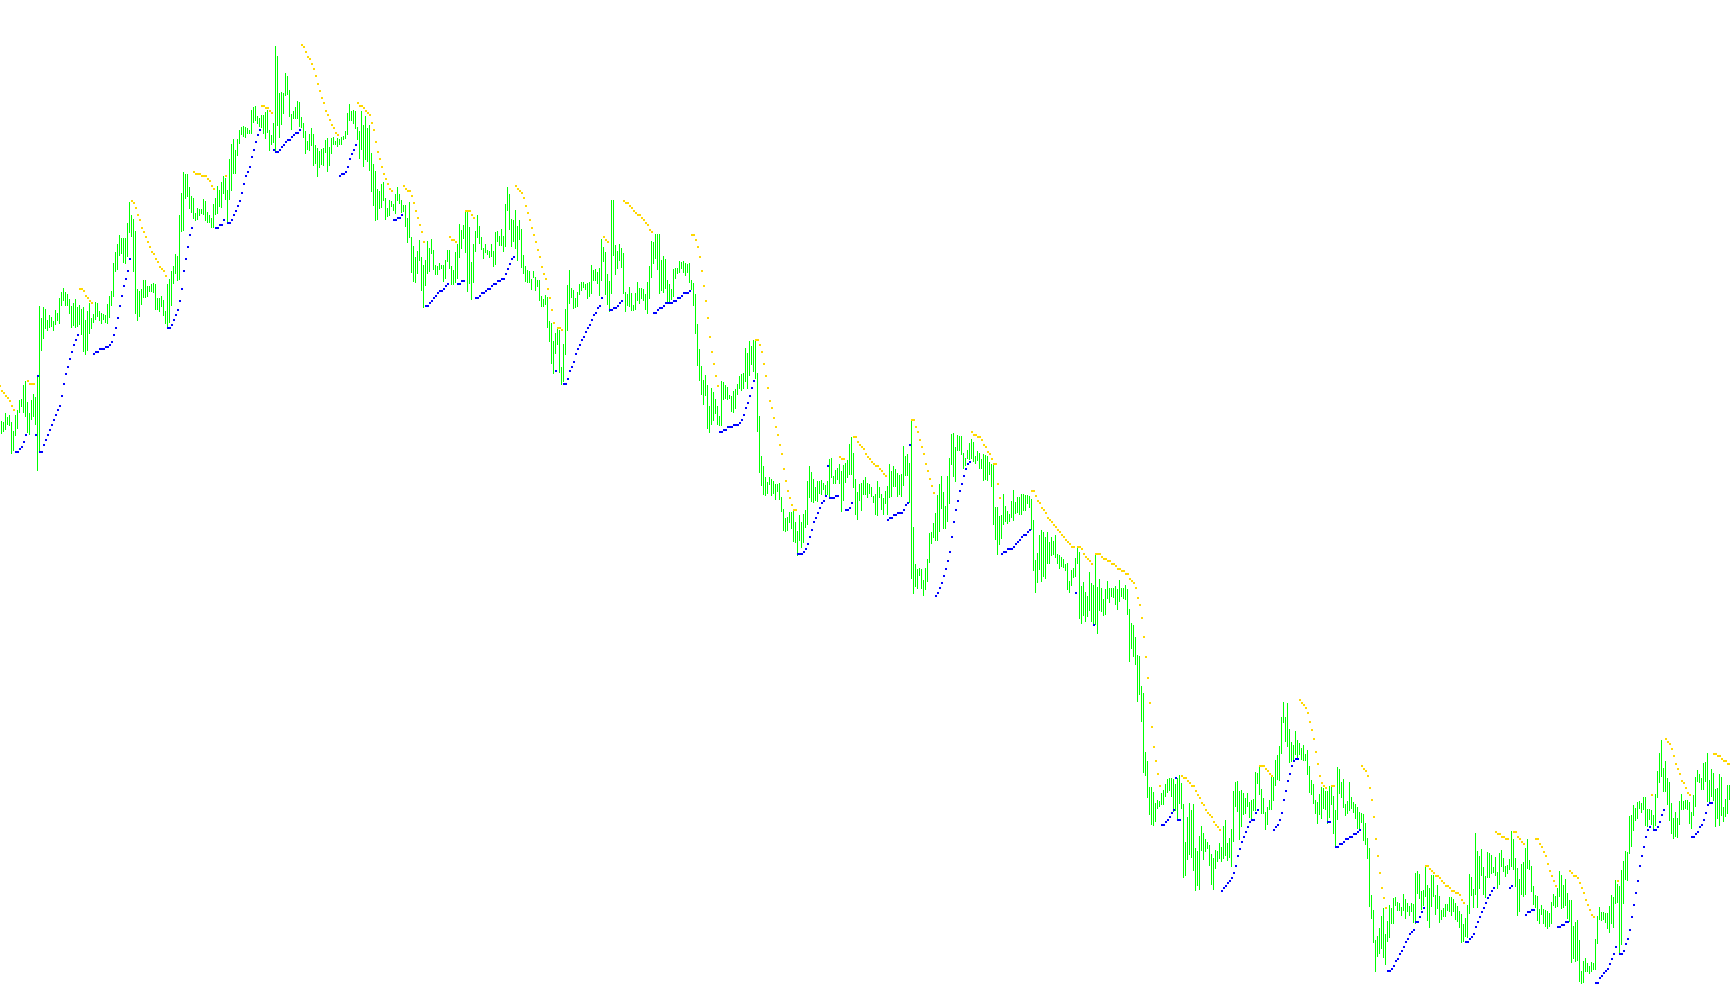
This script is a visual trading tool designed to enhance the standard Parabolic Stop and Reverse (SAR) indicator on your trading charts. While the original SAR often appears as a series of dots, this specific version focuses on providing a clear, color-coded distinction between bullish and bearish market trends by identifying where price action interacts with the SAR value.
How it Works
The logic follows a straightforward process to help traders visualize momentum:
- Trend Detection: The script constantly monitors the "Stop and Reverse" value—a mathematical point that acts as a dynamic ceiling or floor for price movement.
- The Upper Boundary Logic (Bearish): When the calculated SAR value is higher than (or equal to) the current high of the price candle, the script identifies this as an upper boundary. It marks this data point as part of the "SAR Up Channel." On your chart, this helps highlight areas where price is struggling to break upward.
- The Lower Boundary Logic (Bullish): Conversely, if the SAR value falls below the current high of the price candle, the script recognizes that the price has broken through the resistance. It then shifts the focus to the "SAR Down Channel." This signifies that the price is moving aggressively and identifies a new floor for the current trend.
Visual Representation
Instead of overwhelming the screen with constant lines, the tool uses specific markers (arrows) to highlight these transitions:
- Red Markers: These represent the "Up" channel, indicating periods where the SAR is acting as a ceiling.
- Green Markers: These represent the "Down" channel, highlighting periods where the SAR acts as a floor, typically associated with upward momentum.
Summary for Traders
In simple terms, this script takes the complex math of the Parabolic SAR and translates it into a clear visual cue. It effectively tells you whether the current price action is staying "under" a resistance point or has broken out to create a new "floor." By using different colors for these two states, it allows you to see at a glance whether the market sentiment is currently favoring an upward push or a downward pressure.
//+------------------------------------------------------------------+
//|                                                    SAR_COLOR.mq4 |
//|                                                          Kalenzo |
//|                                       http://www.foreksik.prv.pl |
//+------------------------------------------------------------------+
#property copyright "Kalenzo"
#property link      "http://www.foreksik.prv.pl"

#property indicator_color1 Red
#property indicator_color2 Green
#property indicator_chart_window
#property indicator_buffers 2

double sarUp[],sarDn[];//buffers
extern double Step = 0.02;
extern double Maximum = 0.2;
extern int Precision = 4;
//+------------------------------------------------------------------+
//| Custom indicator initialization function                         |
//+------------------------------------------------------------------+
int init()
  {
//---- indicators
   SetIndexStyle(0,DRAW_ARROW,EMPTY,1);
   SetIndexStyle(1,DRAW_ARROW,EMPTY,1);
   SetIndexBuffer(0,sarUp);
   SetIndexBuffer(1,sarDn);
   SetIndexArrow(0,158);
   SetIndexArrow(1,158);

   IndicatorShortName("SAR COLORED");
   SetIndexLabel(0,"SAR Up Channel");
   SetIndexLabel(1,"SAR Down Channel");

   SetIndexDrawBegin(0,2);
   SetIndexDrawBegin(1,2);
//----
   return(0);
  }
//+------------------------------------------------------------------+
//| Custor indicator deinitialization function                       |
//+------------------------------------------------------------------+
int deinit()
  {
//----

//----
   return(0);
  }
//+------------------------------------------------------------------+
//| Custom indicator iteration function                              |
//+------------------------------------------------------------------+
int start()
  {

   int limit;
   int counted_bars=IndicatorCounted();
   if(counted_bars<0) counted_bars=0;
   if(counted_bars>0) counted_bars--;
   limit=Bars-counted_bars;
//----
   for(int i = 0; i<limit ;i++)
   {
      double sar = NormalizeDouble(iSAR(Symbol(),0,Step,Maximum,i),Precision);
      if(sar >= iHigh(Symbol(),0,i))
      {
         sarUp[i] = sar;
         sarDn[i] = 0;
      }
      else
      {
         sarUp[i] = 0;
         sarDn[i] = sar;
      }
   }
//----
   return(0);
  }
//+------------------------------------------------------------------+
Comments