ronz_price_ma_candle
Download script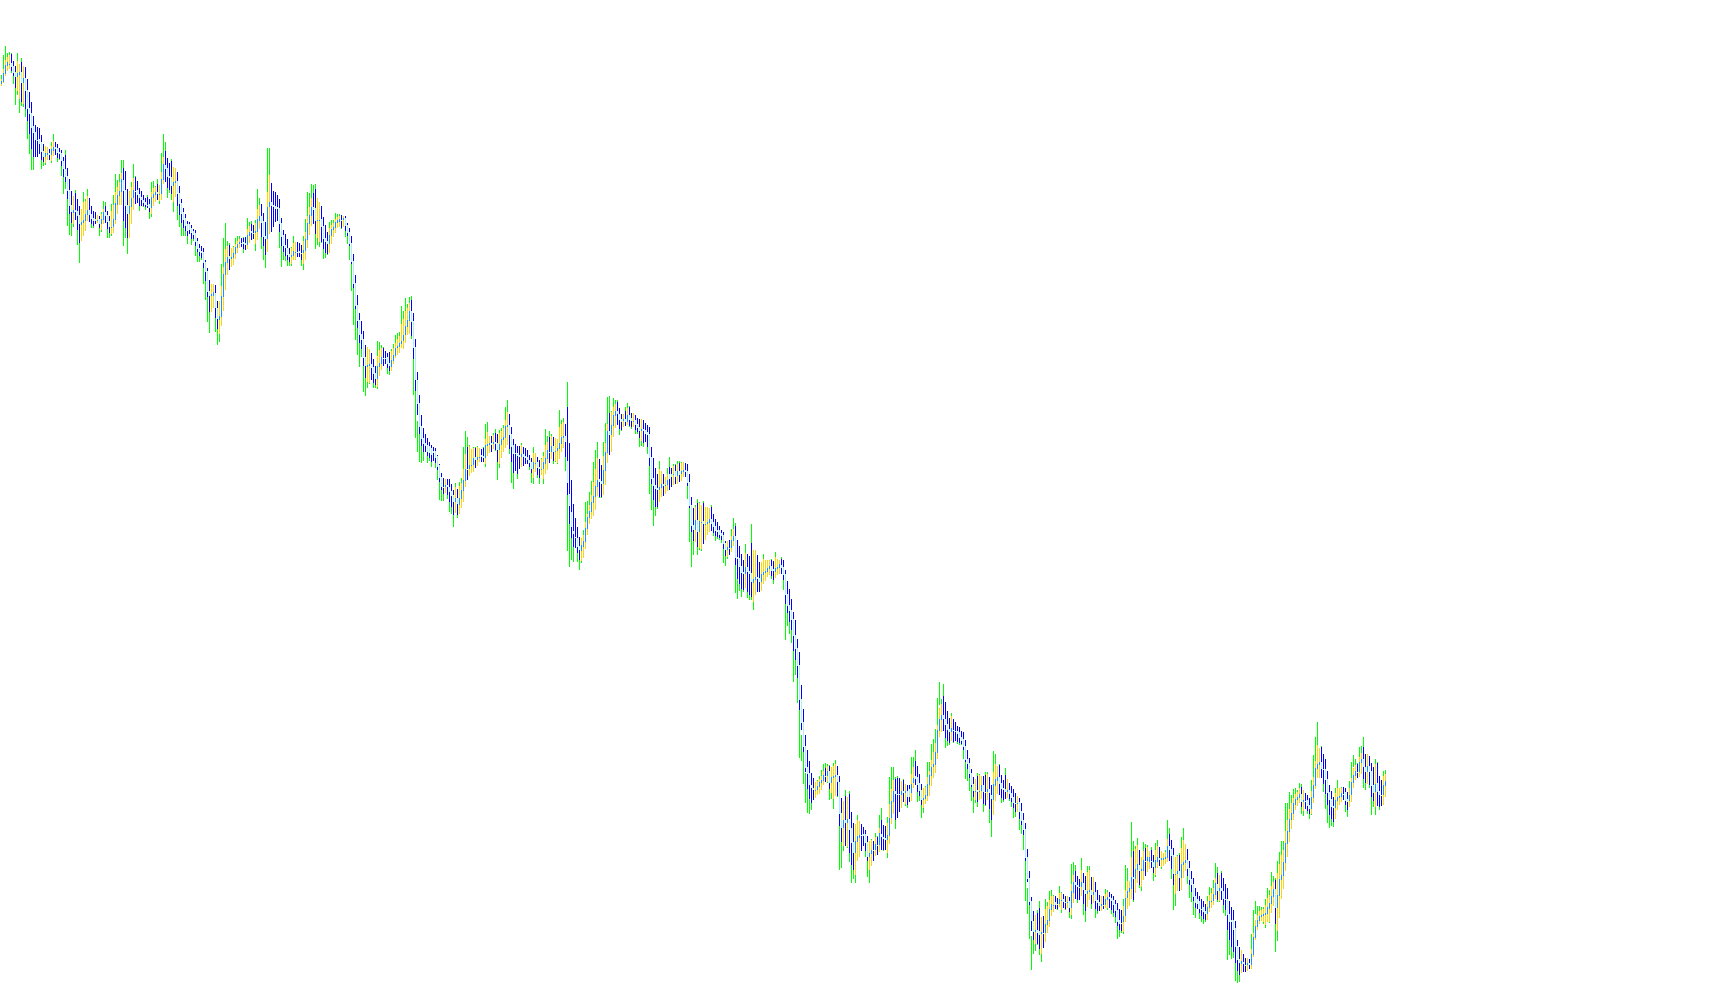
This tool, known as the RoNz Price MA Candle, is designed to provide a smoothed visual representation of price action on your trading charts. Instead of looking at raw, volatile price fluctuations, this script calculates moving averages for specific components of a candle—namely the Open, High, Low, and Close prices—to help identify underlying trends more clearly.
How the Logic Works
The core functionality of the script revolves around "Smoothing" and "Conditional Mapping." Here is a breakdown of how it processes data:
1. Moving Average Calculations The script takes four distinct data points from each price candle:
- The Open price (where the candle started).
- The High price (the highest point reached).
- The Low price (the lowest point reached).
- The Close price (where the candle ended).
It then applies a Moving Average calculation to each of these four points independently. By doing this, it filters out "noise," allowing you to see the average trajectory of each price component over a specific period (which you can customize in the settings).
2. Dynamic Price Mapping One of the unique features of this script is its logical "flipping" mechanism. The script analyzes whether a candle closed higher than it opened:
- If the candle closed higher than it opened: The script maps the "High" average and the "Low" average in a standard way.
- If the candle closed lower than it opened: The script intelligently swaps the mapping of these values.
This logic ensures that the visual data stays consistent with the direction of the price movement, helping to maintain a clear distinction between upper and lower boundaries regardless of individual candle volatility.
3. Visual Representation The script outputs these four calculated averages as different types of histograms on your chart:
- Open and Close Averages: These are displayed with a thicker line/width to highlight the primary body of the "smoothed" candle.
- High and Low Averages: These are displayed as thinner lines, representing the average range or "wicks" of the smoothed price action.
Summary for the User
In plain terms, this script creates a "ghost" candle made entirely out of moving averages. It helps you see where the price wants to go by stripping away the erratic spikes of real-time trading and replacing them with a fluid, averaged path that respects the original direction of the market.
//+------------------------------------------------------------------+
//|                                         RoNz Price MA Candle.mq4 |
//|                                   Copyright 2014, Rony Nofrianto |
//|                                          http://www.feelcomz.com |
//+------------------------------------------------------------------+
#property copyright   "2014, Rony Nofrianto, Indonesia."
#property link        "http://www.feelcomz.com"
#property description "RoNz Price MA Candle"
#property version   "1.00" //Build 141201
#property strict

extern int inpPeriod=4; //Period
extern ENUM_MA_METHOD inpMethod=MODE_EMA; //Method

const string MyShortName="RoNz Price MA Candle";
const string MyID="RPMC";

#property indicator_chart_window
#property indicator_buffers 4

#property indicator_level1 0
#property indicator_levelcolor clrSilver
#property indicator_levelstyle STYLE_DOT

#property indicator_label1  "Low/High"
#property indicator_type1   DRAW_HISTOGRAM
#property indicator_color1  clrWhite
#property indicator_style1  STYLE_SOLID
#property indicator_width1  1

#property indicator_label2  "High/Low"
#property indicator_type2   DRAW_HISTOGRAM
#property indicator_color2  clrRed
#property indicator_style2  STYLE_SOLID
#property indicator_width2  1

#property indicator_label3  "Open"
#property indicator_type3   DRAW_HISTOGRAM
#property indicator_color3  clrRed
#property indicator_style3  STYLE_SOLID
#property indicator_width3  3

#property indicator_label4  "Close"
#property indicator_type4   DRAW_HISTOGRAM
#property indicator_color4  clrWhite
#property indicator_style4  STYLE_SOLID
#property indicator_width4  3

//--- indicator buffers
double   ExtLowHighBuff[],ExtHighLowBuff[],ExtOpenBuff[],ExtCloseBuff[];
//+------------------------------------------------------------------+
//|                                                                  |
//+------------------------------------------------------------------+
int OnInit()
  {

   ChartSetInteger(0,CHART_SHIFT,true);
   ChartSetInteger(0,CHART_MODE,CHART_BARS);
   ChartSetInteger(0,CHART_COLOR_CHART_LINE,clrNONE);

//--- indicator buffers mapping
   SetIndexBuffer(0,ExtLowHighBuff);
   SetIndexBuffer(1,ExtHighLowBuff);
   SetIndexBuffer(2,ExtOpenBuff);
   SetIndexBuffer(3,ExtCloseBuff);

   for(int i=0;i<4;i++)
     {
      SetIndexShift(i,0);
      SetIndexDrawBegin(i,0);
     }
   IndicatorShortName(MyShortName+" ("+(string)inpPeriod+")");
   IndicatorDigits(Digits);

//---
   return(INIT_SUCCEEDED);
  }
//+------------------------------------------------------------------+
//|                                                                  |
//+------------------------------------------------------------------+
int OnCalculate(const int rates_total,
                const int prev_calculated,
                const datetime &time[],
                const double &open[],
                const double &high[],
                const double &low[],
                const double &close[],
                const long &tick_volume[],
                const long &volume[],
                const int &spread[])
  {
//---
   int limit;

//---- Return if no data was calculated before
   if(prev_calculated<0) return(-1);

   if(prev_calculated==0)
     {
      limit=rates_total;
     }
   else
     {
      limit=rates_total-(prev_calculated-1);
     }

   for(int i=0; i<limit && !IsStopped(); i++)
     {

      double FastHighMA= iMA(NULL,0,inpPeriod,0,inpMethod,PRICE_HIGH,i);
      double FastLowMA = iMA(NULL,0,inpPeriod,0,inpMethod,PRICE_LOW,i);
      double FastOpenMA= iMA(NULL,0,inpPeriod,0,inpMethod,PRICE_OPEN,i);
      double FastCloseMA=iMA(NULL,0,inpPeriod,0,inpMethod,PRICE_CLOSE,i);

      if(FastCloseMA>FastOpenMA)
        {
         ExtLowHighBuff[i]=FastHighMA;
         ExtHighLowBuff[i]=FastLowMA;
        }
      else
        {
         ExtLowHighBuff[i]=FastLowMA;
         ExtHighLowBuff[i]=FastHighMA;
        }
      ExtOpenBuff[i]=FastOpenMA;
      ExtCloseBuff[i]=FastCloseMA;

     }

//--- return value of prev_calculated for next call
   return(rates_total);
  }
//+------------------------------------------------------------------+
Comments