RSO
Download script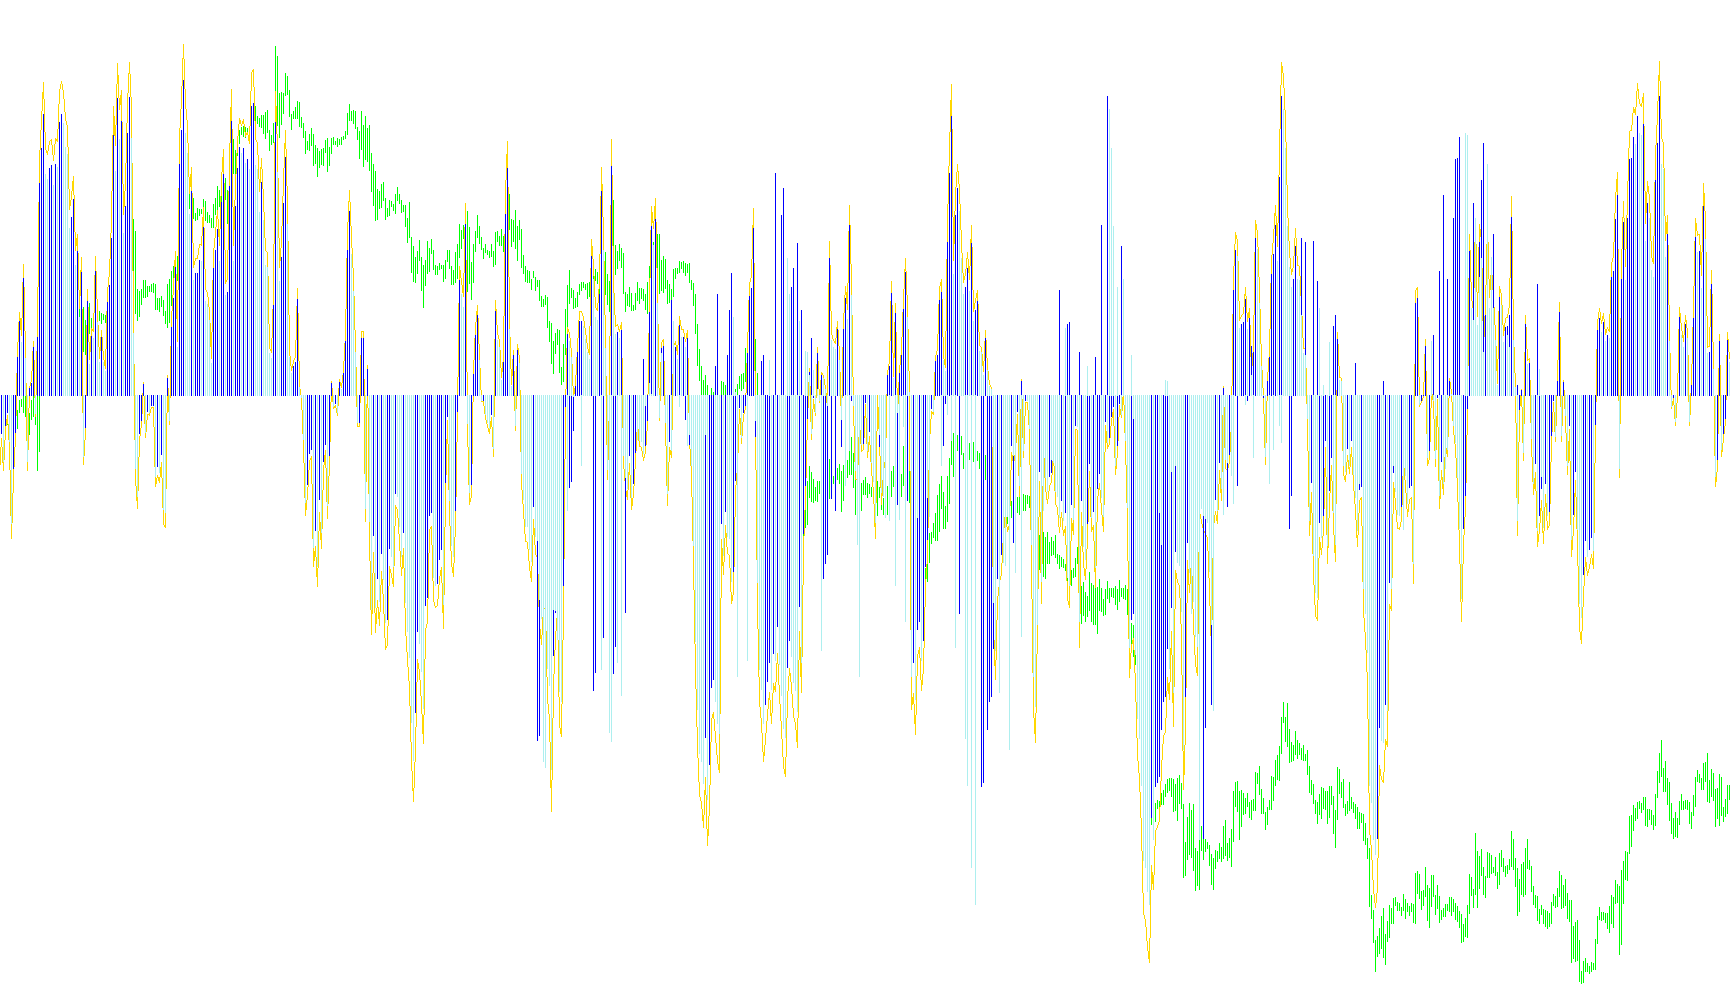
The Relative Strength Oscillator (RSO) is a technical analysis tool designed to help traders visualize the momentum of a financial asset by measuring its "relative strength." Instead of just looking at price movements in isolation, this script analyzes the relationship between upward and downward price changes over a specific period.
How the Logic Works
1. Data Input and Period Selection The script begins by establishing a look-back period (defaulting to 14 bars). This means it examines the most recent 14 price points to determine the current trend. It focuses specifically on the closing prices of these bars.
2. Separating Upward and Downward Movement The core logic works by splitting every price change into two categories:
- Positive Movement: If the price closes higher than it did in the previous bar, that gain is added to an "Upward" bucket.
- Negative Movement: If the price closes lower, the amount of that loss is added to a "Downward" bucket.
By separating these movements, the script ignores "noise" and focuses on the magnitude of the trend in both directions independently.
3. Calculating the Relative Strength The tool then performs a mathematical comparison between these two buckets. It calculates a weighted average based on the ratio of upward movement compared to downward movement.
- This result is normalized into a scale that typically centers around 50.
- If the upward strength significantly outweighs the downward strength, the indicator moves higher.
- If the downward strength dominates, the indicator moves lower.
4. Visual Indicators and Momentum Tracking To make this data easy for a human to read, the script provides three distinct visual elements:
- The Main Line: A continuous line representing the smoothed relative strength. This allows you to see the overall trajectory of the asset's momentum.
- The Histogram Bars: The script identifies when the current value is higher or lower than the previous one. It then draws bars (colored differently based on whether the movement is up or down) to highlight immediate changes in direction.
- Reference Levels: The tool includes horizontal dotted lines (at 20 and -20). These serve as boundaries to help you identify when the asset might be reaching an extreme state of strength or weakness.
Summary for the User
Essentially, this script takes complex price fluctuations and simplifies them into a single "momentum score." By watching how the line moves and how the bars shift color, you can more easily see whether the "bullish" force (buying) or the "bearish" force (selling) is currently winning the tug-of-war, regardless of what the raw price action might look like on its own.
//+------------------------------------------------------------------+
//|                                                          RSO.mq4 |
//|                   Copyright 2005-2014, MetaQuotes Software Corp. |
//|                           Modification by Paran Softwares, 2017. |
//|                                              http://www.mql4.com |
//+------------------------------------------------------------------+
#property copyright   "2005-2014, MetaQuotes Software Corp; 2017, Paran Softwares"
#property link        "http://www.mql4.com"
#property description "Relative Strength Oscillator"
#property strict

#property indicator_separate_window
#property indicator_buffers    3

#property indicator_minimum    -50
#property indicator_maximum    50
#property indicator_level1     -20.0
#property indicator_level2     20.0
#property indicator_levelcolor clrSilver
#property indicator_levelstyle STYLE_DOT
#property indicator_color1     DodgerBlue
#property indicator_color2     Lime
#property indicator_color3     Red
#property indicator_width1     2
#property indicator_width2     2
#property indicator_width3     2

//--- input parameters
extern int InpRSOPeriod = 14;      // RSO Period

//--- buffers
double ExtRSOBuffer[];
double ExtRSOUpBuffer[];
double ExtRSODnBuffer[];
double ExtPosBuffer[];
double ExtNegBuffer[];

//+------------------------------------------------------------------+
//| Custom indicator initialization function                         |
//+------------------------------------------------------------------+
int OnInit(void)
{
   string short_name;
//--- buffers mapping
   IndicatorBuffers(5);
//--- indicator line
   SetIndexBuffer(0, ExtRSOBuffer);
   SetIndexStyle(0, DRAW_LINE);
//--- indicator bars
   SetIndexBuffer(1, ExtRSOUpBuffer);
   SetIndexStyle(1, DRAW_HISTOGRAM);
   SetIndexBuffer(2, ExtRSODnBuffer);
   SetIndexStyle(2, DRAW_HISTOGRAM);

   SetIndexBuffer(3, ExtPosBuffer);
   SetIndexBuffer(4, ExtNegBuffer);
//--- name for DataWindow and indicator subwindow label
   short_name="RSO("+string(InpRSOPeriod)+")";
   IndicatorShortName(short_name);
   SetIndexLabel(0, short_name);
//--- check for input
   if(InpRSOPeriod < 2)
     {
      Print("Incorrect value for input variable InpRSOPeriod = ", InpRSOPeriod);
      Print("Corrected to 14!");
      InpRSOPeriod = 14;
     }
//---
   SetIndexDrawBegin(0, InpRSOPeriod);
   SetIndexDrawBegin(1, InpRSOPeriod);
   SetIndexDrawBegin(2, InpRSOPeriod);
//--- initialization done
   return(INIT_SUCCEEDED);
}

//+------------------------------------------------------------------+
//| Relative Strength Index                                          |
//+------------------------------------------------------------------+
int OnCalculate(const int rates_total,
                const int prev_calculated,
                const datetime &time[],
                const double &open[],
                const double &high[],
                const double &low[],
                const double &close[],
                const long &tick_volume[],
                const long &volume[],
                const int &spread[])
{
   int    i, pos;
   double diff;
//---
   if(Bars<=InpRSOPeriod || InpRSOPeriod<2)
      return(0);
//--- counting from 0 to rates_total
   ArraySetAsSeries(ExtRSOBuffer, false);
   ArraySetAsSeries(ExtRSOUpBuffer, false);
   ArraySetAsSeries(ExtRSODnBuffer, false);
   ArraySetAsSeries(ExtPosBuffer, false);
   ArraySetAsSeries(ExtNegBuffer, false);
   ArraySetAsSeries(close, false);
//--- preliminary calculations
   pos = prev_calculated-1;
   if(pos <= InpRSOPeriod)
   {
      //--- first RSIPeriod values of the indicator are not calculated
      ExtRSOBuffer[0]=0.0;
      ExtPosBuffer[0]=0.0;
      ExtNegBuffer[0]=0.0;
      double sump=0.0;
      double sumn=0.0;
      for(i=1; i<=InpRSOPeriod; i++)
        {
         ExtRSOBuffer[i]=0.0;
         ExtPosBuffer[i]=0.0;
         ExtNegBuffer[i]=0.0;
         diff=close[i]-close[i-1];
         if(diff>0)
            sump+=diff;
         else
            sumn-=diff;
      }
      //--- calculate first visible value
      ExtPosBuffer[InpRSOPeriod]=sump/InpRSOPeriod;
      ExtNegBuffer[InpRSOPeriod]=sumn/InpRSOPeriod;
      if(ExtNegBuffer[InpRSOPeriod]!=0.0)
         ExtRSOBuffer[InpRSOPeriod]=50.0-(100.0/(1.0+ExtPosBuffer[InpRSOPeriod]/ExtNegBuffer[InpRSOPeriod]));
      else
      {
         if(ExtPosBuffer[InpRSOPeriod]!=0.0)
            ExtRSOBuffer[InpRSOPeriod]=50.0;
         else
            ExtRSOBuffer[InpRSOPeriod]=0.0;
      }
      //--- prepare the position value for main calculation
      pos = InpRSOPeriod+1;
   }

//--- the main loop of calculations
   for(i=pos; i<rates_total && !IsStopped(); i++)
   {
      diff=close[i]-close[i-1];
      ExtPosBuffer[i]=(ExtPosBuffer[i-1]*(InpRSOPeriod-1)+(diff>0.0?diff:0.0))/InpRSOPeriod;
      ExtNegBuffer[i]=(ExtNegBuffer[i-1]*(InpRSOPeriod-1)+(diff<0.0?-diff:0.0))/InpRSOPeriod;
      if(ExtNegBuffer[i]!=0.0)
         ExtRSOBuffer[i]=50.0-100.0/(1+ExtPosBuffer[i]/ExtNegBuffer[i]);
      else
      {
         if(ExtPosBuffer[i]!=0.0)
            ExtRSOBuffer[i]=50.0;
         else
            ExtRSOBuffer[i]=0.0;
      }

      if(ExtRSOBuffer[i] - ExtRSOBuffer[i-1] < 0)
         ExtRSODnBuffer[i] = 0.9*ExtRSOBuffer[i];
      else
         ExtRSOUpBuffer[i] = 0.9*ExtRSOBuffer[i];
   }
//---
   return(rates_total);
}
Comments