multitimeframemovingaverages
Download script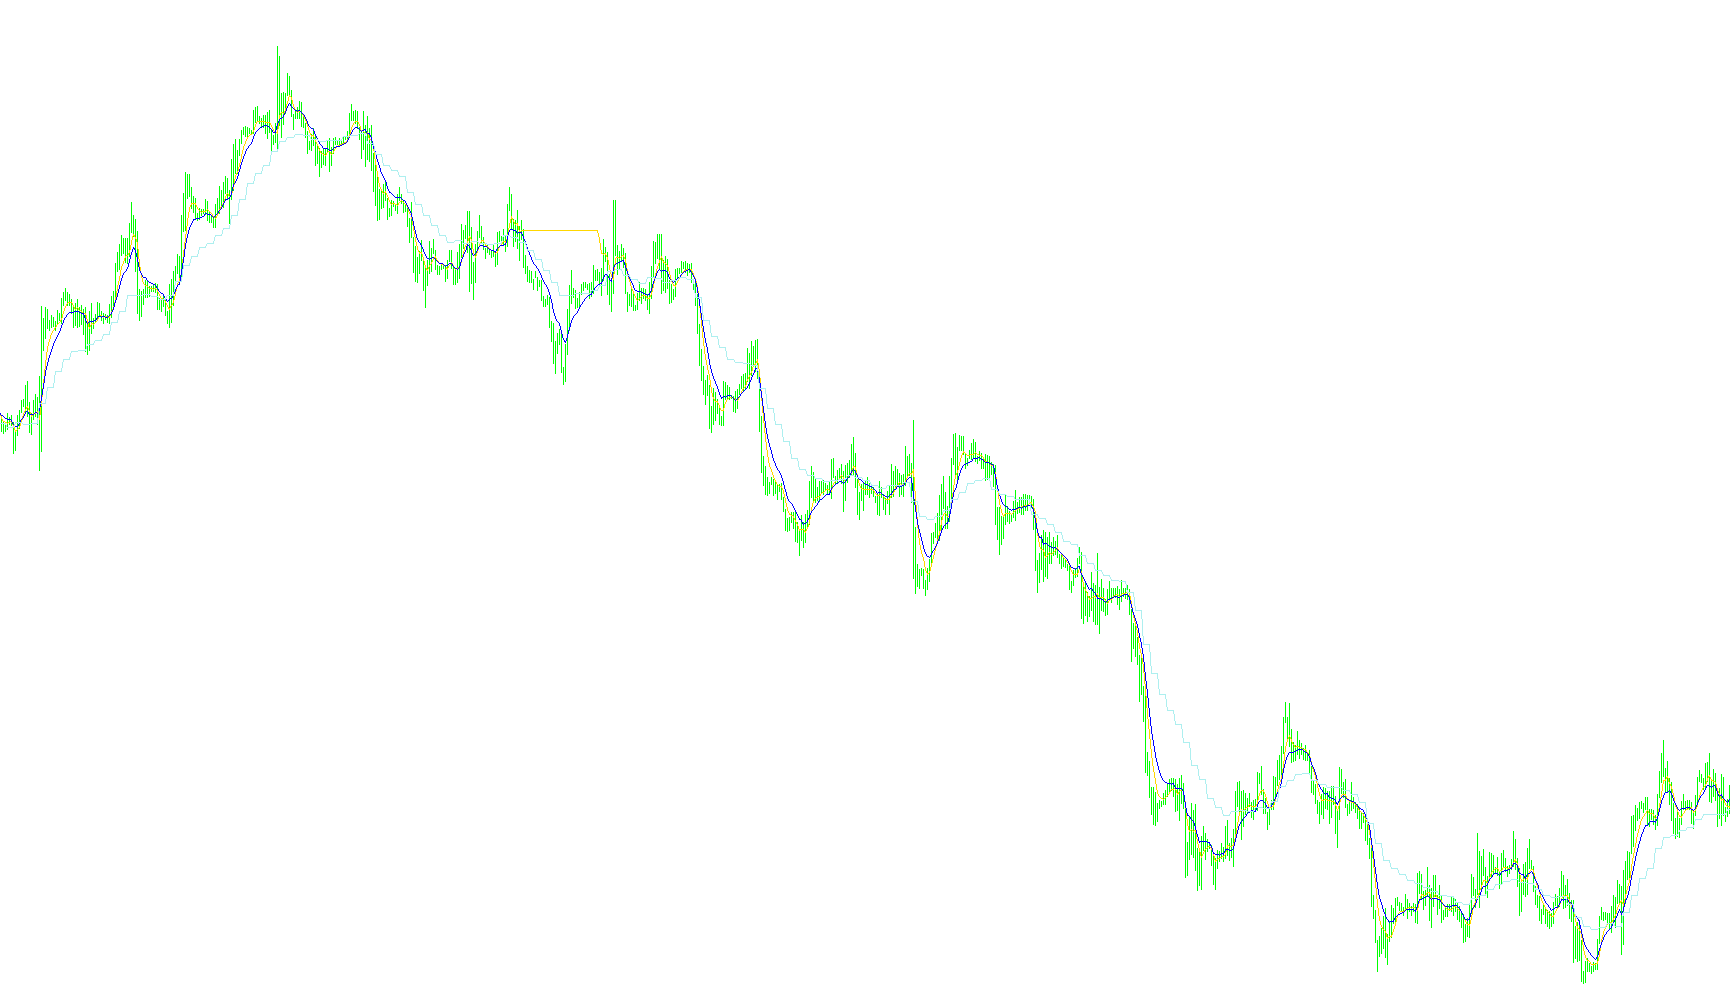
This script is designed to provide traders with a comprehensive view of market trends by overlaying multiple moving averages from different timeframes onto a single price chart. Instead of forcing you to switch back and forth between various charts (like 30-minute, 1-hour, and 4-hour views) to see the "big picture," this tool consolidates that information into one visual workspace.
Core Functionality
The logic operates by pulling data from three distinct timeframes simultaneously: a Minimum, Middle, and Maximum timeframe. For example, while you are looking at a short-term chart, the script can reach out and calculate the averages for much larger time periods.
Key features of the logic include:
- Timeframe Synchronization: The tool automatically identifies where the current time on your screen corresponds to the bars on the larger timeframes. It ensures that the moving average displayed at any given moment accurately reflects the trend of that specific period.
- Customizable Smoothing: You can choose how the averages are calculated (e.g., Simple, Exponential, Smoothed, or Linear Weighted). This allows you to adjust how "reactive" or "smooth" the lines appear based on your personal trading style.
- Visual Organization: The script displays these as three distinct lines on your chart, color-coded for clarity. It also includes a toggle system, allowing you to turn specific timeframes on or off depending on what you need to see at any given moment.
- Smart Display Logic: To keep the chart clean and relevant, the script contains a safety check during initialization. If the timeframe you are currently viewing is larger than one of the settings (for instance, if you are on a 4-hour chart but have a 30-minute average enabled), it intelligently manages how those lines appear to ensure the data remains meaningful.
Practical Use Case
By using this logic, a trader can stay on a lower timeframe to spot precise entry points while simultaneously observing the "major" trendlines from higher timeframes. It effectively removes the need for manual tab-switching, providing a multi-dimensional view of market momentum in a single window.
//+------------------------------------------------------------------+
//|                                 MultiTimeFrameMovingAverages.mq4 |
//|                        Copyright 2016, MetaQuotes Software Corp. |
//|                                             https://www.mql5.com |
//+------------------------------------------------------------------+
#property copyright "Copyright 2016, MetaQuotes Software Corp."
#property link      "https://www.mql5.com"
#property version   "1.00"
#property strict
#property indicator_chart_window
#property indicator_buffers 3
#property indicator_plots   3
//--- plot Min MA
#property indicator_label1  "Min MA"
#property indicator_type1   DRAW_LINE
#property indicator_color1  clrRed
#property indicator_style1  STYLE_SOLID
#property indicator_width1  1
//--- plot Middle MA
#property indicator_label2  "Middle MA"
#property indicator_type2   DRAW_LINE
#property indicator_color2  clrGreen
#property indicator_style2  STYLE_SOLID
#property indicator_width2  1
//--- plot Max MA
#property indicator_label3  "Max MA"
#property indicator_type3   DRAW_LINE
#property indicator_color3  clrBlue
#property indicator_style3  STYLE_SOLID
#property indicator_width3  1
//--- input parameters
input ENUM_TIMEFRAMES      InpMinTimeFrame=PERIOD_M30;// Min Time Frame
input ENUM_TIMEFRAMES      InpMiddleTimeFrame=PERIOD_H1;// Middle Time Frame
input ENUM_TIMEFRAMES      InpMaxTimeFrame=PERIOD_H4;// Max TimeFrame
input int      InpMAPeriod=10;// averaging period
input int      InpMAShif=0;//// horizontal shift
input ENUM_MA_METHOD      InpMAMethod=MODE_EMA;// smoothing type
input ENUM_APPLIED_PRICE      InpAppliedPrice=PRICE_CLOSE;// type of price or handle
input bool      InpShowMin=true;// Show Min
input bool      InpShowMiddle=true;// Show Middle
input bool      InpShowMax=true;// Show Max
//--- indicator buffers
double         MinMABuffer[];
double         MiddleMABuffer[];
double         MaxMABuffer[];
bool      ShowMin=InpShowMin;
bool      ShowMiddle=InpShowMiddle;
bool      ShowMax=InpShowMax;
const string currentSymbol=Symbol();
const ENUM_TIMEFRAMES currentPeriod=PERIOD_CURRENT;
//+------------------------------------------------------------------+
//| Custom indicator initialization function                         |
//+------------------------------------------------------------------+
int OnInit()
  {
//--- indicator buffers mapping
   SetIndexBuffer(0,MinMABuffer);
   SetIndexBuffer(1,MiddleMABuffer);
   SetIndexBuffer(2,MaxMABuffer);
   SetIndexLabel(0,"Min MA ("+IntegerToString(InpMinTimeFrame)+")");
   SetIndexLabel(1,"Middle MA ("+IntegerToString(InpMiddleTimeFrame)+")");
   SetIndexLabel(2,"Max MA ("+IntegerToString(InpMaxTimeFrame)+")");
//---- name for DataWindow and indicator subwindow label
   string short_name="";
   switch(InpMAMethod)
     {
      case MODE_SMA  : short_name="SMA"; break;
      case MODE_EMA  : short_name="EMA";  break;
      case MODE_SMMA : short_name="SMMA"; break;
      case MODE_LWMA : short_name="LWMA"; break;
      default : return(INIT_FAILED);
     }
   IndicatorShortName("Multi TimeFrame "+short_name+" ("+IntegerToString(InpMAPeriod)+")");
   if(currentPeriod>InpMinTimeFrame)
     {
      ShowMin=false;
     }
   if(currentPeriod>InpMiddleTimeFrame)
     {
      ShowMiddle=false;
     }
   if(currentPeriod>InpMaxTimeFrame)
     {
      ShowMax=false;
     }
//---- initialization done
   return(INIT_SUCCEEDED);
  }
//+------------------------------------------------------------------+
//| Custom indicator iteration function                              |
//+------------------------------------------------------------------+
int OnCalculate(const int rates_total,
                const int prev_calculated,
                const datetime &time[],
                const double &open[],
                const double &high[],
                const double &low[],
                const double &close[],
                const long &tick_volume[],
                const long &volume[],
                const int &spread[])
  {
   int i,limit;
//--- last counted bar will be recounted
   limit=rates_total-prev_calculated;
   if(prev_calculated>0)
      limit++;
   int MinShift=-1,MiddleShift=-1,MaxShift=-1;
   double MinMAValue=NULL,MiddleMAValue=NULL,MaxMAValue=NULL;
   for(i=0; i<limit; i++)
     {
      if(ShowMin)
        {
         int _MinShift=iBarShift(currentSymbol,InpMinTimeFrame,time[i],false);
         if(MinShift != _MinShift|| _MinShift == 0 )
           {
            MinShift=_MinShift;
            MinMAValue=iMA(currentSymbol,InpMinTimeFrame,InpMAPeriod,InpMAShif,InpMAMethod,InpAppliedPrice,MinShift);
           }
         MinMABuffer[i]=MinMAValue;
        }
      if(ShowMiddle)
        {
         int _MiddleShift=iBarShift(currentSymbol,InpMiddleTimeFrame,time[i],false);
         if(MiddleShift!=_MiddleShift || _MiddleShift==0)
           {
            MiddleShift=_MiddleShift;
            MiddleMAValue=iMA(currentSymbol,InpMiddleTimeFrame,InpMAPeriod,InpMAShif,InpMAMethod,InpAppliedPrice,MiddleShift);
           }
         MiddleMABuffer[i]=MiddleMAValue;
        }
      if(ShowMax)
        {
         int _MaxShift=iBarShift(currentSymbol,InpMaxTimeFrame,time[i],false);
         if(MaxShift!=_MaxShift || _MaxShift==0)
           {
            MaxShift=_MaxShift;
            MaxMAValue=iMA(currentSymbol,InpMaxTimeFrame,InpMAPeriod,InpMAShif,InpMAMethod,InpAppliedPrice,MaxShift);
           }
         MaxMABuffer[i]=MaxMAValue;
        }
     }
//--- return value of prev_calculated for next call
   return(rates_total);
  }
//+------------------------------------------------------------------+
Comments