NonLag_Inverse_fisher_transform_of_RSX
Download script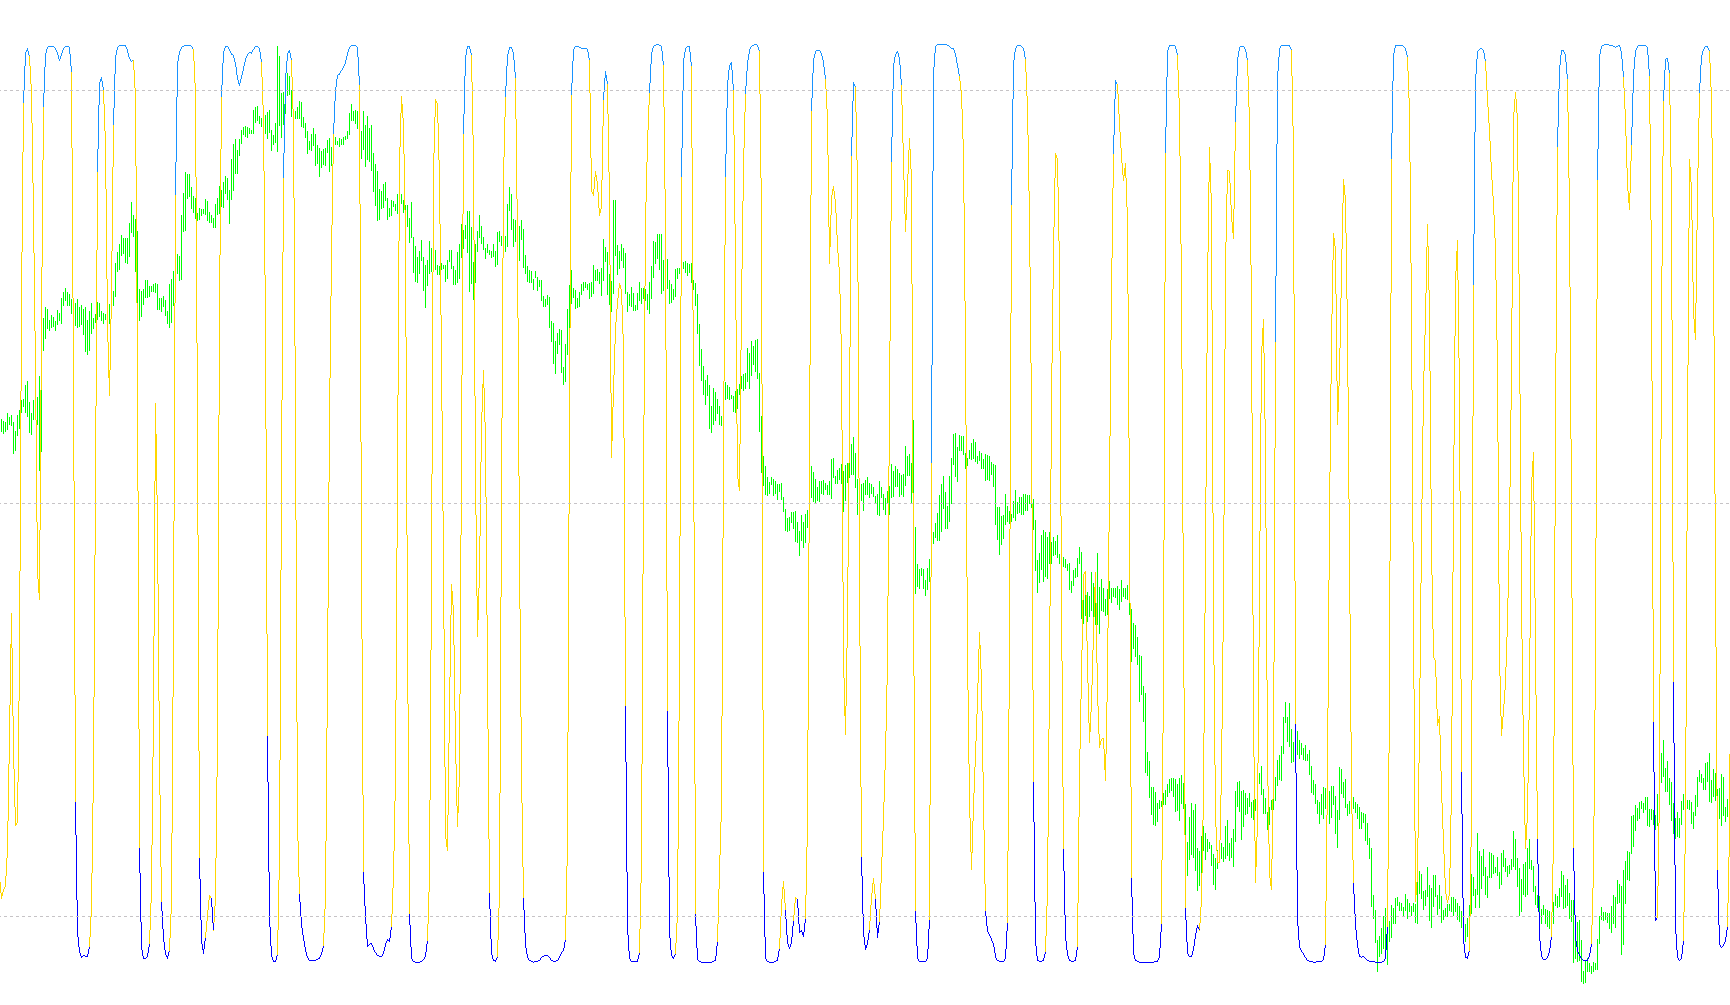
Indicator Overview
This script is a specialized technical analysis tool designed to identify and visualize market trends by combining several advanced mathematical concepts into a single visual indicator. Unlike standard oscillators that might provide "noisy" data, this logic focuses on smoothing out market fluctuations to highlight the underlying direction of price movement.
Core Logic Components
The indicator functions by layering four distinct mathematical processes:
1. Relative Strength Index (RSX) Foundation The script begins by calculating a specialized version of the Relative Strength Index (RSX). While a standard RSI measures the speed and change of price movements, the RSX used here incorporates extra smoothing components. This helps in capturing the momentum of the market while filtering out minor, insignificant price "jitters."
2. Non-Lag Smoothing To ensure the indicator reacts quickly to new information without creating false signals (a common problem known as "lag"), the script applies a "Non-Lag Moving Average." This is a sophisticated smoothing technique that calculates weighted values based on historical data to provide a more fluid and responsive line than a standard moving average.
3. Inverse Fisher Transform The primary "engine" of this script is the Inverse Fisher Transform. This mathematical formula takes the smoothed momentum data and converts it into a distinct visual range (typically between -1 and 1). Its purpose is to exaggerate price trends, making it much easier for a trader to see when a trend is accelerating or exhausting, as it forces the line into clearer directional peaks and valleys.
4. Trend Identification and Visual Coloring The script interprets the results of the Fisher Transform to determine the current market regime:
- Bullish Trend: When the values exceed a high threshold (Level 1), the indicator identifies an upward trend.
- Bearish Trend: When the values drop below a low threshold (Level 3), it identifies a downward trend.
- Neutral Zone: If the values remain between these levels, the script treats the market as undecided or consolidating.
Visual Presentation
The logic is designed to provide a clean, high-contrast visual experience on your chart:
- Dynamic Plotting: Instead of showing one continuous line that might switch colors mid-move, the script uses "PlotPoint" and "CleanPoint" logic. This ensures that when the trend switches, the lines are rendered clearly without overlapping or leaving confusing artifacts behind.
- Multi-Timeframe Compatibility: The script includes a built-in mechanism to pull data from higher timeframes (e.g., looking at Daily trends while on a 15-minute chart). It also features an "Interpolation" logic that mathematically calculates intermediate values to ensure the trend line appears smooth even when moving between different timeframes.
Summary for the User
In simple terms, this tool takes raw price action, filters out the "noise" using advanced smoothing (Non-Lag), identifies the momentum (RSX), and then projects that momentum into a clear, readable trend format (Inverse Fisher). The result is a visual guide that highlights whether the market is currently in a state of bullish expansion, bearish contraction, or neutral consolidation.
//+------------------------------------------------------------------+
//|                              Inverse fisher transform of RSI.mq4 |
//|                                                           mladen |
//+------------------------------------------------------------------+
#property  copyright "mladen"
#property  link      "mladenfx@gmail.com"

#property  indicator_separate_window
#property  indicator_buffers    5
#property  indicator_color1     clrSilver
#property  indicator_color2     clrSandyBrown
#property  indicator_color3     clrSandyBrown
#property  indicator_color4     clrDeepSkyBlue
#property  indicator_color5     clrDeepSkyBlue
#property  indicator_width1     2
#property  indicator_width2     2
#property  indicator_width3     2
#property  indicator_width4     2
#property  indicator_width5     2
#property  indicator_maximum    1.05
#property  indicator_minimum   -1.05
#property  strict

//
//
//
//
//

extern ENUM_TIMEFRAMES    TimeFrame   = PERIOD_CURRENT;  // Time frame
extern int                Length      =  5;              // Period
extern ENUM_APPLIED_PRICE Price       =  PRICE_CLOSE;    // Price
extern int                NlLength    =  15;             // NonLag smoothing period
extern double             Level1      =  0.90;           // Level 1
extern double             Level2      =  0.0;            // Level 2
extern double             Level3      = -0.90;           // Level 3
extern bool               Interpolate = true;            // Interpolate in multi time frame mode

//
//
//
//
//

double ifishua[],ifishub[],ifishda[],ifishdb[],ifisher[],trend[],count[];
string indicatorFileName;
#define _mtfCall(_buff,_y) iCustom(NULL,TimeFrame,indicatorFileName,PERIOD_CURRENT,Length,Price,NlLength,Level1,Level2,Level3,_buff,_y)

//------------------------------------------------------------------
//
//------------------------------------------------------------------
//
//
//
//
//

int OnInit()
{
   IndicatorBuffers(7);
      SetIndexBuffer(0,ifisher);
      SetIndexBuffer(1,ifishda);
      SetIndexBuffer(2,ifishdb);
      SetIndexBuffer(3,ifishua);
      SetIndexBuffer(4,ifishub);
      SetIndexBuffer(5,trend);
      SetIndexBuffer(6,count);
         SetLevelValue(0,Level1);
         SetLevelValue(1,Level2);
         SetLevelValue(2,Level3);

      //
      //
      //
      //
      //

      indicatorFileName = WindowExpertName();
      TimeFrame         = MathMax(TimeFrame,_Period);
   IndicatorShortName(timeFrameToString(TimeFrame)+" nonlag inverse fisher of RSX ("+(string)Length+","+(string)NlLength+")");
   return(INIT_SUCCEEDED);
}
void OnDeinit(const int reason) { return;}

//------------------------------------------------------------------
//
//------------------------------------------------------------------
//
//
//
//
//

int OnCalculate (const int       rates_total,
                 const int       prev_calculated,
                 const datetime& time[],
                 const double&   open[],
                 const double&   high[],
                 const double&   low[],
                 const double&   close[],
                 const long&     tick_volume[],
                 const long&     volume[],
                 const int&      spread[] )
{
   int limit=MathMax(rates_total-prev_calculated-1,0); count[0]=limit;
      if (TimeFrame!=_Period)
      {
         limit = (int)MathMax(limit,MathMin(rates_total-1,_mtfCall(6,0)*TimeFrame/_Period));
         if (trend[limit]== 1) CleanPoint(limit,ifishua,ifishub);
         if (trend[limit]==-1) CleanPoint(limit,ifishda,ifishdb);
         int i=limit; for (; i>=0 && !_StopFlag; i--)
         {
            int y = iBarShift(NULL,TimeFrame,time[i]);
               ifisher[i] = _mtfCall(0,y);
               trend[i]   = _mtfCall(5,y);
               ifishda[i] = EMPTY_VALUE;
               ifishdb[i] = EMPTY_VALUE;
               ifishua[i] = EMPTY_VALUE;
               ifishub[i] = EMPTY_VALUE;
               if (!Interpolate || (i>0 && y==iBarShift(NULL,TimeFrame,time[i-1]))) continue;

               //
               //
               //
               //
               //

               #define _interpolate(buff) buff[i+k] = buff[i]+(buff[i+n]-buff[i])*k/n
               int n,k; datetime ctime = iTime(NULL,TimeFrame,y);
                  for(n = 1; (i+n)<rates_total && time[i+n] >= ctime; n++) continue;
                  for(k = 1; k<n && (i+n)<rates_total && (i+k)<rates_total; k++) _interpolate(ifisher);
         }
         for (i=limit; i>=0 && !_StopFlag; i--)
         {
            if (trend[i]== 1) PlotPoint(i,ifishua,ifishub,ifisher);
            if (trend[i]==-1) PlotPoint(i,ifishda,ifishdb,ifisher);
         }
         return(rates_total-i-1);
      }

   //
   //
   //
   //
   //

   if (trend[limit]== 1) CleanPoint(limit,ifishua,ifishub);
   if (trend[limit]==-1) CleanPoint(limit,ifishda,ifishdb);
   int i=limit; for(int r=Bars-i-1; i>=0 && !_StopFlag; i--,r++)
   {
      double avg = iNonLagMa(0.1 * (iRsx(iMA(NULL,0,1,0,MODE_SMA,Price,i),Length,i,rates_total)-50),NlLength,i,rates_total);
         ifisher[i] = (MathExp(2*avg)-1)/(MathExp(2*avg)+1);
         trend[i]   = (i<rates_total-1) ? trend[i+1] : 0;
            if (ifisher[i] < Level1 && ifisher[i] > Level3) trend[i] =  0;
            if (ifisher[i] > Level1)                        trend[i] =  1;
            if (ifisher[i] < Level3)                        trend[i] = -1;

            //
            //
            //
            //
            //

            ifishda[i] = EMPTY_VALUE; ifishdb[i] = EMPTY_VALUE;
            ifishua[i] = EMPTY_VALUE; ifishub[i] = EMPTY_VALUE;
         if (trend[i]== 1) PlotPoint(i,ifishua,ifishub,ifisher);
         if (trend[i]==-1) PlotPoint(i,ifishda,ifishdb,ifisher);
   }
   return(rates_total-i-1);
}

//------------------------------------------------------------------
//
//------------------------------------------------------------------
//
//
//
//
//
//

#define _rsiInstances     1
#define _rsiInstancesSize 13
double workRsi[][_rsiInstances*_rsiInstancesSize];
#define _price  0
#define _change 1
#define _changa 2

double iRsx(double price, double period, int i, int bars, int instanceNo=0)
{
   if (ArrayRange(workRsi,0)!=bars) ArrayResize(workRsi,bars);
      int z = instanceNo*_rsiInstancesSize;
      int r = bars-i-1;

   //
   //
   //
   //
   //

   workRsi[r][z+_price] = price;
      double Kg = (3.0)/(2.0+period), Hg = 1.0-Kg;
            if (r<1) { for (int k=1; k<13; k++) workRsi[r][k+z] = 0; return(50); }

            //
            //
            //
            //
            //

            double mom = workRsi[r][_price+z]-workRsi[r-1][_price+z];
            double moa = MathAbs(mom);
            for (int k=0; k<3; k++)
            {
               int kk = k*2;
               workRsi[r][z+kk+1] = Kg*mom                + Hg*workRsi[r-1][z+kk+1];
               workRsi[r][z+kk+2] = Kg*workRsi[r][z+kk+1] + Hg*workRsi[r-1][z+kk+2]; mom = 1.5*workRsi[r][z+kk+1] - 0.5 * workRsi[r][z+kk+2];
               workRsi[r][z+kk+7] = Kg*moa                + Hg*workRsi[r-1][z+kk+7];
               workRsi[r][z+kk+8] = Kg*workRsi[r][z+kk+7] + Hg*workRsi[r-1][z+kk+8]; moa = 1.5*workRsi[r][z+kk+7] - 0.5 * workRsi[r][z+kk+8];
            }
            return(MathMax(MathMin((mom/MathMax(moa,DBL_MIN)+1.0)*50.0,100.00),0.00));
}

//------------------------------------------------------------------
//
//------------------------------------------------------------------
//
//
//
//
//

#define _length  0
#define _len     1
#define _weight  2

double  nlmvalues[ ][3];
double  nlmprices[ ][1];
double  nlmalphas[ ][1];

//
//
//
//
//

double iNonLagMa(double price, double length, int r, int bars, int instanceNo=0)
{
   if (ArrayRange(nlmprices,0) != bars)         ArrayResize(nlmprices,bars);
   if (ArrayRange(nlmvalues,0) <  instanceNo+1) ArrayResize(nlmvalues,instanceNo+1); r=bars-r-1;
                               nlmprices[r][instanceNo]=price;
   if (length<5 || r<3) return(nlmprices[r][instanceNo]);

   //
   //
   //
   //
   //

   if (nlmvalues[instanceNo][_length] != length)
   {
      double Cycle = 4.0;
      double Coeff = 3.0*M_PI;
      int    Phase = (int)(length-1);

         nlmvalues[instanceNo][_length] =       length;
         nlmvalues[instanceNo][_len   ] = (int)(length*4) + Phase;
         nlmvalues[instanceNo][_weight] = 0;

         if (ArrayRange(nlmalphas,0) < (int)nlmvalues[instanceNo][_len]) ArrayResize(nlmalphas,(int)nlmvalues[instanceNo][_len]);
         for (int k=0; k<(int)nlmvalues[instanceNo][_len]; k++)
         {
            double t;
            if (k<=Phase-1)
                  t = 1.0 * k/(Phase-1);
            else  t = 1.0 + (k-Phase+1)*(2.0*Cycle-1.0)/(Cycle*length-1.0);
            double beta = MathCos(M_PI*t);
            double g = 1.0/(Coeff*t+1); if (t <= 0.5 ) g = 1;

            nlmalphas[k][instanceNo]        = g * beta;
            nlmvalues[instanceNo][_weight] += nlmalphas[k][instanceNo];
         }
   }

   //
   //
   //
   //
   //

   if (nlmvalues[instanceNo][_weight]>0)
   {
      double sum = 0;
           for (int k=0; k < (int)nlmvalues[instanceNo][_len] && (r-k)>=0; k++) sum += nlmalphas[k][instanceNo]*nlmprices[r-k][instanceNo];
           return( sum / nlmvalues[instanceNo][_weight]);
   }
   else return(0);
}

//-------------------------------------------------------------------
//
//-------------------------------------------------------------------
//
//
//
//
//

void CleanPoint(int i,double& first[],double& second[])
{
   if (i>=Bars-2) return;
   if ((second[i]  != EMPTY_VALUE) && (second[i+1] != EMPTY_VALUE))
        second[i+1] = EMPTY_VALUE;
   else
      if ((first[i] != EMPTY_VALUE) && (first[i+1] != EMPTY_VALUE) && (first[i+2] == EMPTY_VALUE))
          first[i+1] = EMPTY_VALUE;
}

void PlotPoint(int i,double& first[],double& second[],double& from[])
{
   if (i>=Bars-2) return;
   if (first[i+1] == EMPTY_VALUE)
      if (first[i+2] == EMPTY_VALUE)
            { first[i]  = from[i]; first[i+1]  = from[i+1]; second[i] = EMPTY_VALUE; }
      else  { second[i] = from[i]; second[i+1] = from[i+1]; first[i]  = EMPTY_VALUE; }
   else     { first[i]  = from[i];                          second[i] = EMPTY_VALUE; }
}

//
//
//
//
//

string sTfTable[] = {"M1","M5","M15","M30","H1","H4","D1","W1","MN"};
int    iTfTable[] = {1,5,15,30,60,240,1440,10080,43200};

string timeFrameToString(int tf)
{
   for (int i=ArraySize(iTfTable)-1; i>=0; i--)
         if (tf==iTfTable[i]) return(sTfTable[i]);
                              return("");
}
Comments