my-envelope
Download script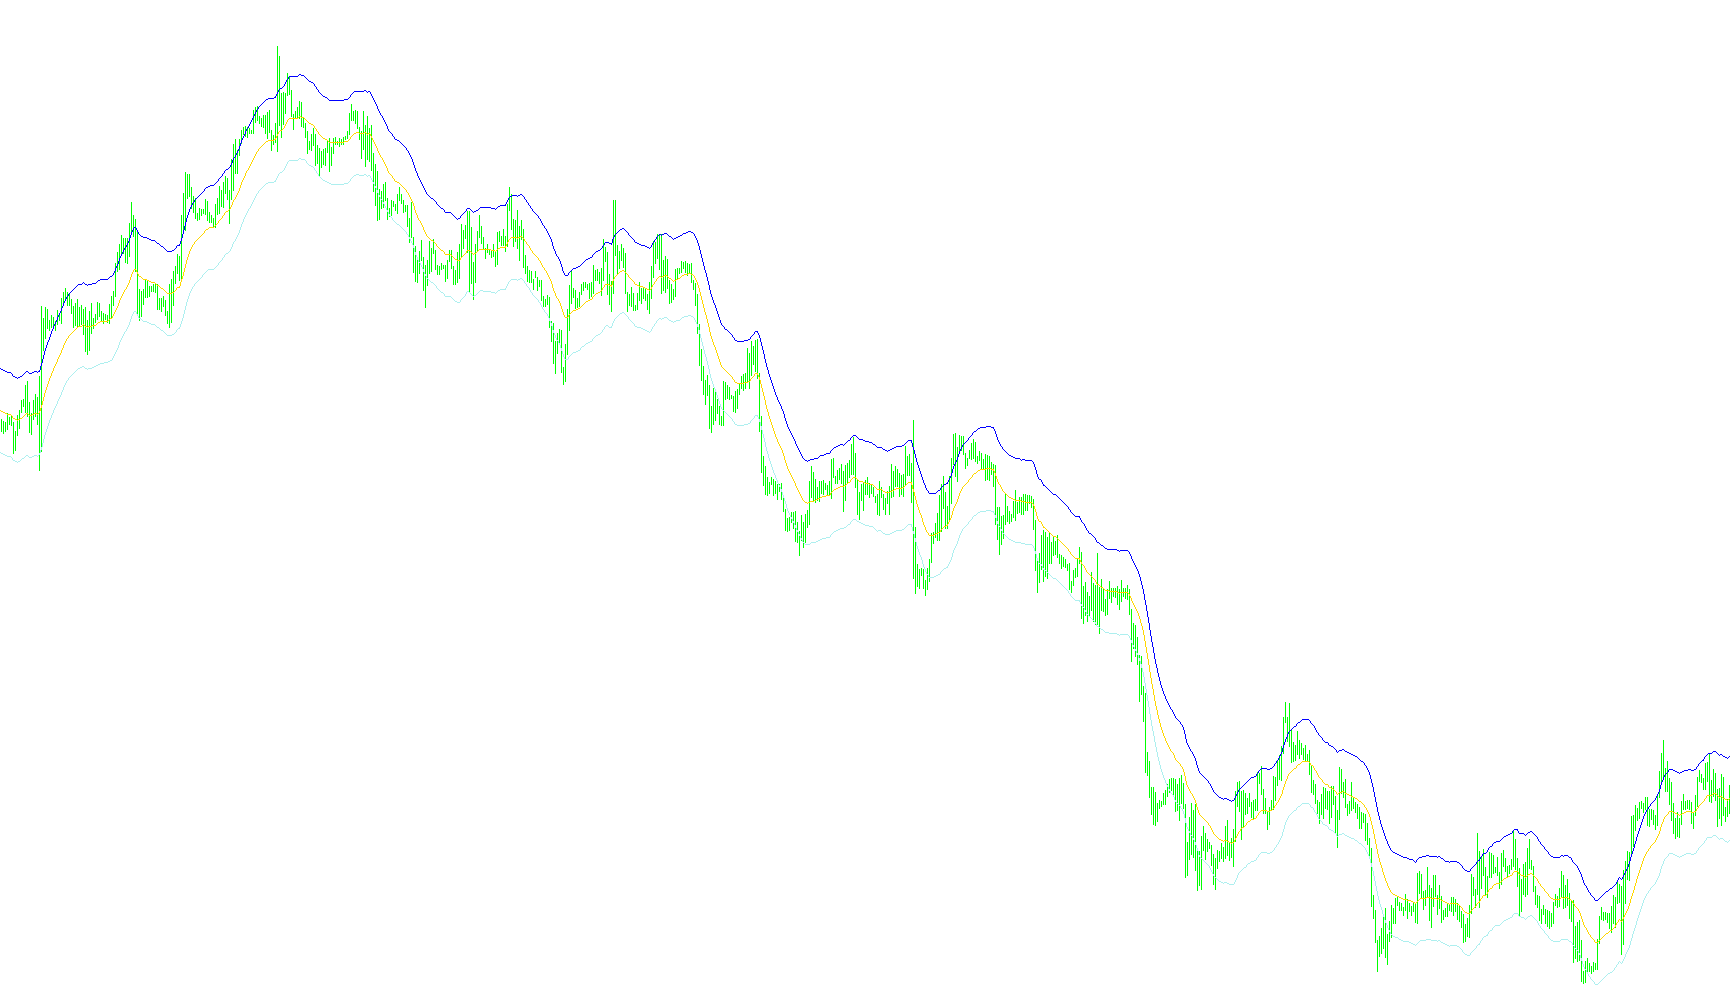
Overview
This tool is a custom technical analysis indicator designed to help traders visualize market trends and identify potential overextended price zones. It works by creating a dynamic "envelope" or channel around the current price action, providing a visual framework for understanding whether the market is trending steadily or moving at an extreme pace.
How the Logic Works
The script operates using three primary components to generate its visual output:
1. The Baseline (Moving Average) The core of the indicator is based on a "Slow" Exponential Moving Average (EMA). Think of this as a smoothed-out line that represents the general direction of the market over a set period. It filters out minor price fluctuations to show you the "true" underlying trend.
2. The Volatility Measurement (Standard Deviation) To determine how wide or narrow the envelope should be, the tool calculates the "Standard Deviation" based on a "Fast" EMA. In simple terms, this measures how much the price is swinging away from its average.
- If the market is calm and moving steadily, this value will be low.
- If the market is volatile and experiencing large, erratic jumps, this value will be high.
3. The Envelope Calculation The indicator then combines these two pieces of information to draw two outer boundary lines (the Upper and Lower buffers):
- Upper Boundary: This is calculated by taking the Baseline and adding a specific multiplier of the Volatility Measurement.
- Lower Boundary: This is calculated by taking the Baseline and subtracting that same multiplier.
Visual Summary for the Trader
On your chart, this results in three distinct lines:
- The Center Line: Represents the primary trend.
- The Upper Line: Acts as a ceiling. When price reaches this area, it may indicate that the market is temporarily "overbought" or stretched too far to the upside.
- The Lower Line: Acts as a floor. When price reaches this area, it may indicate that the market is temporarily "oversold" or stretched too far to the downside.
By watching how the price interacts with these boundaries, traders can better identify potential reversal points or periods of intense market exhaustion.
//+------------------------------------------------------------------+
//|                                                   myEnvelope.mq4 |
//|                      Copyright © 2011, MetaQuotes Software Corp. |
//|                                        http://www.metaquotes.net |
//+------------------------------------------------------------------+
#property copyright "Copyright © 2011, MetaQuotes Software Corp."
#property link      "http://www.metaquotes.net"

#property indicator_chart_window
#property indicator_buffers 3
#property indicator_color1 Blue
#property indicator_color2 Orange
#property indicator_color3 Orange

extern int FastEMA = 13;
extern int SlowEMA = 21;
extern double n = 2.7;

double EMABuffer[];
double UpperBuffer[];
double LowerBuffer[];

//+------------------------------------------------------------------+
//| Custom indicator initialization function                         |
//+------------------------------------------------------------------+
int init()
  {
//---- indicators
   SetIndexStyle(0,DRAW_LINE);
   SetIndexStyle(1,DRAW_LINE);
   SetIndexStyle(2,DRAW_LINE);
//   SetIndexDrawBegin(1,EMA);
//   IndicatorDigits(Digits+1);
//   IndicatorShortName("Envelope("+EMA+")");

   IndicatorBuffers(3);
   SetIndexEmptyValue(0,0.0);
   SetIndexBuffer(0,EMABuffer);
   SetIndexEmptyValue(1,0.0);
   SetIndexBuffer(1,UpperBuffer);
   SetIndexEmptyValue(2,0.0);
   SetIndexBuffer(2,LowerBuffer);

//----
   return(0);
  }
//+------------------------------------------------------------------+
//| Custom indicator deinitialization function                       |
//+------------------------------------------------------------------+
int deinit()
  {
//----

//----
   return(0);
  }
//+------------------------------------------------------------------+
//| Custom indicator iteration function                              |
//+------------------------------------------------------------------+
int start()
  {
   int counted_bars=IndicatorCounted();
   double sd;
//----
   for(int i = 0;i < (Bars - counted_bars);i++){
      EMABuffer[i] = iMA(NULL,0,SlowEMA,0,MODE_EMA,PRICE_CLOSE,i);
   }
   sd = iStdDev(NULL,0,FastEMA,0,MODE_EMA,PRICE_CLOSE,0);
   for(i = 0;i < (Bars - counted_bars);i++){
      UpperBuffer[i] = EMABuffer[i] + n * sd;
      LowerBuffer[i] = EMABuffer[i] - n * sd;
   }
//----
   return(0);
  }
//+------------------------------------------------------------------+
Comments