//+------------------------------------------------------------------+
//|                                               MultiTimeFrame.mq4 |
//|                        Copyright 2015, MetaQuotes Software Corp. |
//|                                             https://www.mql5.com
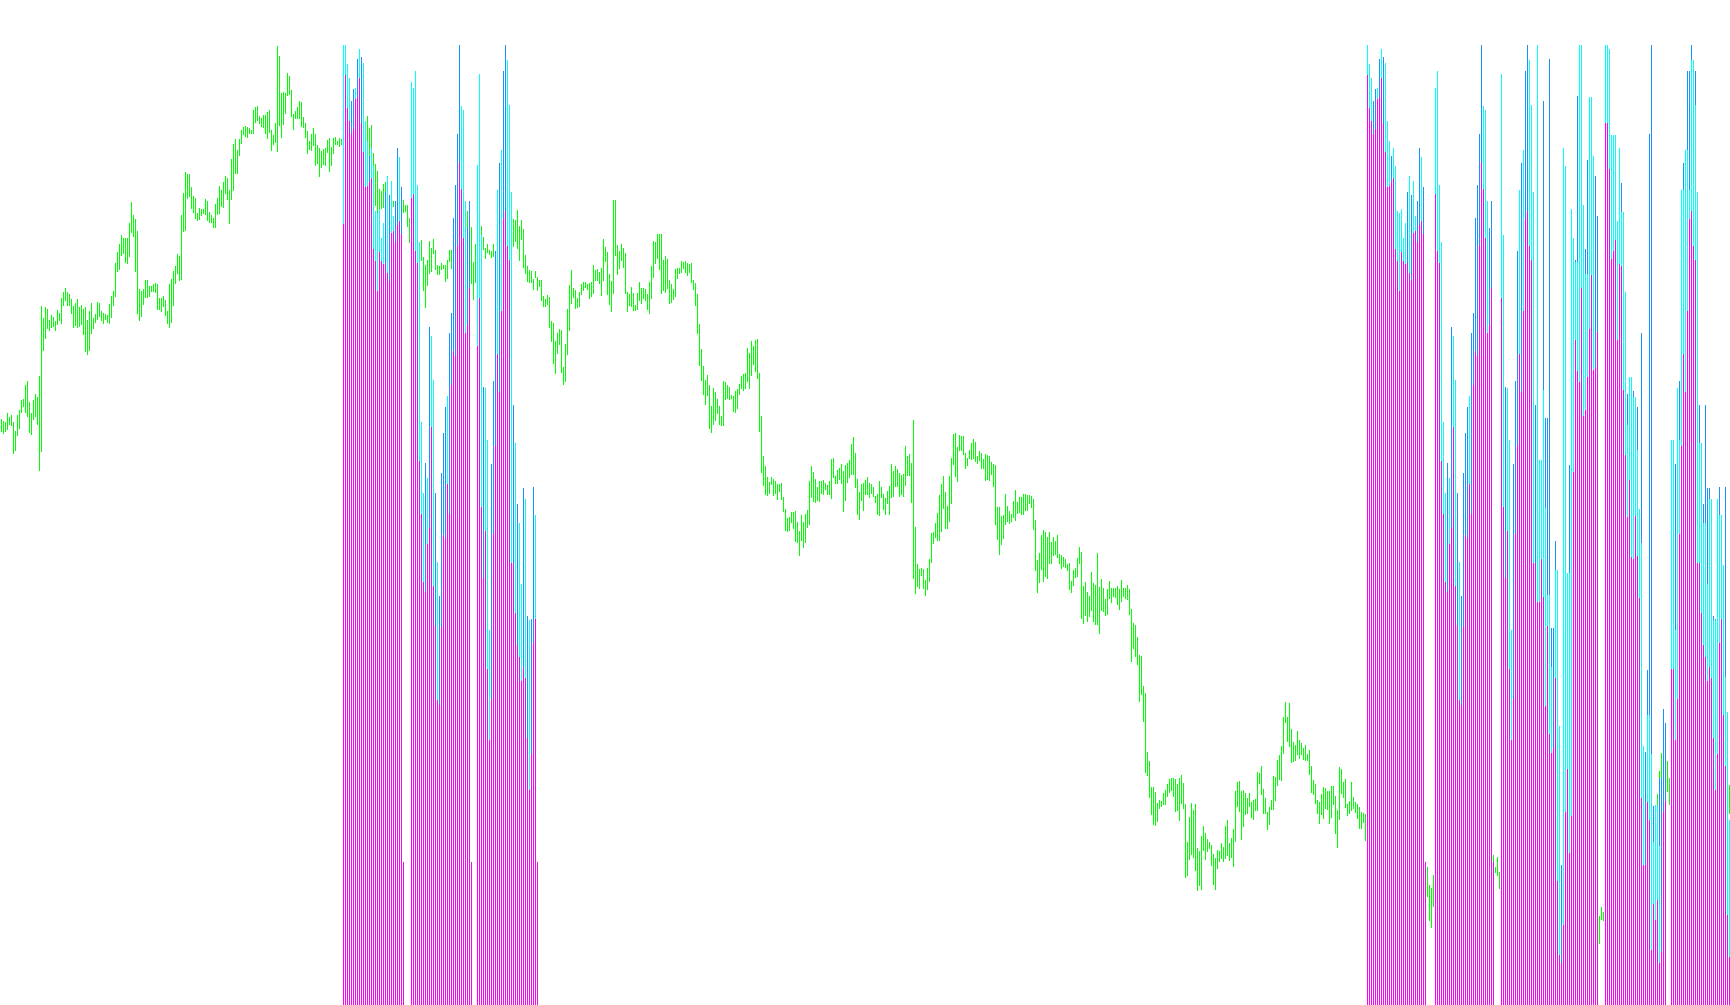
//This indicator help you keep 3 different Time frames on the screen
//to see the price action clearly on both short term and long term
//without switching buttons.
//+------------------------------------------------------------------+
#property copyright "Copyright 2015, MetaQuotes Software Corp."
#property link      "https://www.mql5.com"
#property version   "1.00"
#property strict
#property indicator_separate_window
#property indicator_buffers 6
#property indicator_plots   6

//--- plot BU
#property indicator_label1  "BU"
#property indicator_type1   DRAW_HISTOGRAM
#property indicator_color1  clrLime
#property indicator_style1  STYLE_SOLID
#property indicator_width1  3
//--- plot BD
#property indicator_label2  "BD"
#property indicator_type2   DRAW_HISTOGRAM
#property indicator_color2  clrRed
#property indicator_style2  STYLE_SOLID
#property indicator_width2  3
//--- plot BS
#property indicator_label3  "BS"
#property indicator_type3   DRAW_HISTOGRAM
#property indicator_color3  clrBlack
#property indicator_style3  STYLE_SOLID
#property indicator_width3  3
//--- plot SU
#property indicator_label4  "SU"
#property indicator_type4   DRAW_HISTOGRAM
#property indicator_color4  clrLime
#property indicator_style4  STYLE_SOLID
#property indicator_width4  1
//--- plot SD
#property indicator_label5  "SD"
#property indicator_type5   DRAW_HISTOGRAM
#property indicator_color5  clrRed
#property indicator_style5  STYLE_SOLID
#property indicator_width5  1
//--- plot SS
#property indicator_label6  "SS"
#property indicator_type6   DRAW_HISTOGRAM
#property indicator_color6  clrBlack
#property indicator_style6  STYLE_SOLID
#property indicator_width6  1


input ENUM_TIMEFRAMES      TF1=PERIOD_W1;
input ENUM_TIMEFRAMES      TF2=PERIOD_D1;
input ENUM_TIMEFRAMES      TF3=PERIOD_H4;
input int      BarsPerTF=30;

//--- indicator buffers
//
//bullish body
double         BUBuffer[];
//bearish body
double         BDBuffer[];
//body mask
double         BMBuffer[];
//bullish shadow
double         SUBuffer[];
//bearish shadow
double         SDBuffer[];
//shadow mask
double         SMBuffer[];
//+------------------------------------------------------------------+
//| Custom indicator initialization function                         |
//+------------------------------------------------------------------+
int OnInit()
  {
//--- indicator buffers mapping

   SetIndexBuffer(0,BUBuffer);
   SetIndexBuffer(1,BDBuffer);
   SetIndexBuffer(2,BMBuffer);
   SetIndexBuffer(3,SUBuffer);
   SetIndexBuffer(4,SDBuffer);
   SetIndexBuffer(5,SMBuffer);
///////// Set Index 2 & 5 colors to chart background color (to mask histogram bars and make it looks like a candle)
/* long res;
   ChartGetInteger(ChartID(),CHART_COLOR_BACKGROUND,0,res);

   SetIndexStyle(2,EMPTY ,EMPTY ,EMPTY ,(color)res);
   SetIndexStyle(5,EMPTY ,EMPTY ,EMPTY ,(color)res);*/
//////////////

   ArrayInitialize(BUBuffer,EMPTY_VALUE);
   ArrayInitialize(BDBuffer,EMPTY_VALUE);
   ArrayInitialize(BMBuffer,EMPTY_VALUE);
   ArrayInitialize(SUBuffer,EMPTY_VALUE);
   ArrayInitialize(SDBuffer,EMPTY_VALUE);
   ArrayInitialize(SMBuffer,EMPTY_VALUE);

//---
   return(INIT_SUCCEEDED);
  }
//+------------------------------------------------------------------+
//| Custom indicator iteration function                              |
//+------------------------------------------------------------------+
int OnCalculate(const int rates_total,
                const int prev_calculated,
                const datetime &time[],
                const double &open[],
                const double &high[],
                const double &low[],
                const double &close[],
                const long &tick_volume[],
                const long &volume[],
                const int &spread[])
  {
//---

   int TF=TF1,index=0;

   double H,L,_l,_h,h1,h2,h3,l1,l2,l3;
//highest point in  tf1
   h1=iHigh(NULL,TF1,iHighest(NULL,TF1,MODE_HIGH,BarsPerTF));
//highest point in  tf2
   h2=iHigh(NULL,TF2,iHighest(NULL,TF2,MODE_HIGH,BarsPerTF));
//highest point in  tf3
   h3=iHigh(NULL,TF3,iHighest(NULL,TF3,MODE_HIGH,BarsPerTF));
//lowest point in  tf1
   l1=iLow(NULL,TF1,iLowest(NULL,TF1,MODE_LOW,BarsPerTF));
//lowest point in  tf2
   l2=iLow(NULL,TF2,iLowest(NULL,TF2,MODE_LOW,BarsPerTF));
//lowest point in  tf3
   l3=iLow(NULL,TF3,iLowest(NULL,TF3,MODE_LOW,BarsPerTF));

//highest point in  all tfs
   H=MathMax(
             h1,
             MathMax(h2,h3)
             );
//lowest point in  all tfs
   L=MathMin(
             l1,
             MathMin(l2,l3)
             );

   _l=l1;
   _h=h1;
//loop 3 times
   for(int x=1; x<4; x++)
     {

      for(int i=0; i<BarsPerTF; i++)
        {
         //drawing index
         index=i+BarsPerTF *(x-1);

         // set specific variables for each iteration
         if(x==1)
           { TF=TF1; _h=h1;_l=l1; }
         if(x==2)
           { TF=TF2;_h=h2;   index+=BarsPerTF/8;;_l=l2;  }
         if(x==3)
           { TF=TF3;_h=h3;   index+=BarsPerTF/4;;_l=l3; }

         //     collect open close high low and shift it to the scale of [H-L] using the formula of range shifting
         // NewValue = (((OldValue - OldMin) * (NewMax - NewMin)) / (OldMax - OldMin)) + NewMin

         double c = ( (iClose(NULL, TF,  i ) - _l) / (_h - _l) ) * (H - L) + L;
         double o = ( (iOpen(NULL, TF,  i ) - _l) / (_h - _l) )* (H - L) + L;
         double h = ( (iHigh(NULL, TF,  i )  - _l) / (_h - _l) ) * (H - L) + L;
         double l =( (iLow(NULL, TF,  i )  - _l) / (_h - _l) ) * (H - L) + L;
         //fill the buffers
         if(c>=o)
           {
            BUBuffer[index]= c;
            BMBuffer[index]= o;
            SUBuffer[index]= h;
            SMBuffer[index]= l;
           }
         else
           {
            BDBuffer[index]=o;
            BMBuffer[index]= c;
            SDBuffer[index]= h;
            SMBuffer[index]= l;
           }
        }

     }
//--- return value of prev_calculated for next call
   return(rates_total);
  }
//+------------------------------------------------------------------+

Comments