AltrTrend_Signal_v2_2_v1
Download script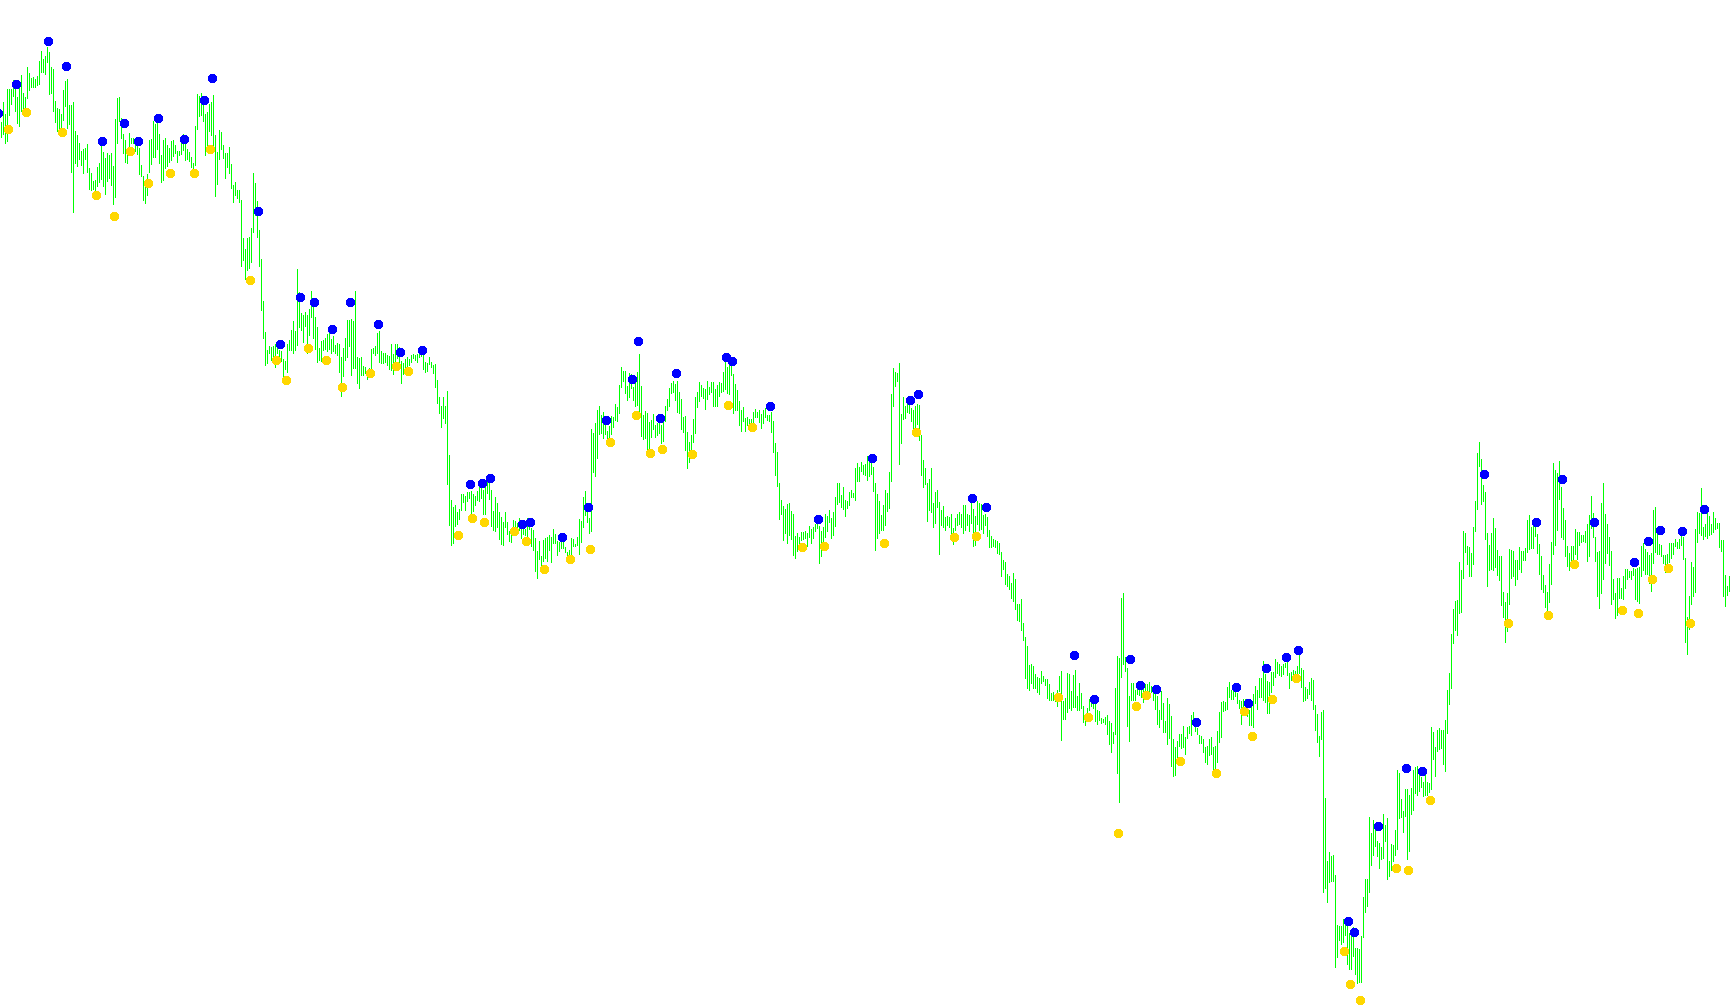
This tool is designed to identify and signal potential trend reversals or breakouts in the financial markets by analyzing price action dynamics. Instead of simply looking at whether a price is moving up or down, the logic focuses on identifying specific "breakout zones" based on historical volatility and price range.
How the Logic Works
1. Dynamic Range Assessment The script first calculates a variable "look-back" period. Rather than using a fixed number of candles, it uses an average movement indicator (ADX) to determine how much data is needed to assess the current market strength. This allows the tool to adapt its perspective based on whether the market is currently calm or highly volatile.
2. Volatility and Price Boundaries For every point in time, the logic calculates the average height of price candles within that dynamic look-back period. It then establishes two "threshold" boundaries:
- A Lower Boundary: Calculated by taking the lowest price reached in that period and adjusting it based on a user-defined sensitivity percentage.
- An Upper Boundary: Calculated by taking the highest price reached in that period and applying the same adjustment.
3. Trend Detection The script constantly monitors the closing price of candles against these calculated boundaries:
- If the price closes significantly above the Upper Boundary, the logic registers a shift toward an Uptrend.
- If the price closes significantly below the Lower Boundary, it registers a shift toward a Downtrend.
4. Signal Generation The visual signals (arrows) on your chart are triggered only at the specific moment the trend status changes (e.g., flipping from neutral/down to up).
- Buy Signals: When a transition to an uptrend is confirmed, a green signal appears below the candle.
- Sell Signals: When a transition to a downtrend is confirmed, a crimson signal appears above the candle.
The distance of these signals from the candles is automatically adjusted based on the recent market range, ensuring that the markers remain clearly visible and consistent regardless of how "stretched" or "compressed" the price action is.
//+------------------------------------------------------------------+
//| AltrTrend_Signal_v2_2.mq4
//| Ramdass - Conversion only
//+------------------------------------------------------------------+
#property  copyright "Author - OlegVS, GOODMAN"

#property indicator_chart_window
#property indicator_buffers 2
#property indicator_color1 Green
#property indicator_color2 Crimson

//---- input parameters
extern int K=30;
extern double Kstop=0.5;
extern int Kperiod=150;
extern int PerADX=14;
extern int CountBars=999999;

//---- buffers
double val1[];
double val2[];

//+------------------------------------------------------------------+
//| Custom indicator initialization function                         |
//+------------------------------------------------------------------+
int init()
  {
   string short_name;
//---- indicator line
   IndicatorBuffers(2);
   SetIndexStyle(0,DRAW_ARROW);
   SetIndexArrow(0,108);
   SetIndexStyle(1,DRAW_ARROW);
   SetIndexArrow(1,108);
   SetIndexBuffer(0,val1);
   SetIndexBuffer(1,val2);
//----
   return(0);
  }
//+------------------------------------------------------------------+
//| AltrTrend_Signal_v2_2                                            |
//+------------------------------------------------------------------+
int start()
  {
   if (CountBars>=Bars) CountBars=Bars;
   SetIndexDrawBegin(0,Bars-CountBars+PerADX);
   SetIndexDrawBegin(1,Bars-CountBars+PerADX);
   int i,shift,counted_bars=IndicatorCounted();
   int i1,i2;
   double Range,AvgRange,smin,smax,SsMax,SsMin,SSP,price;
   bool uptrend,old;
//----
   if(Bars<=PerADX+1) return(0);
//---- initial zero
   if(counted_bars<PerADX+1)
   {
      for(i=1;i<=PerADX;i++) val1[CountBars-i]=0.0;
      for(i=1;i<=PerADX;i++) val2[CountBars-i]=0.0;
   }
//----


for (shift = CountBars-PerADX; shift>=0; shift--)
{

SSP=MathCeil(Kperiod/iADX(NULL,0,PerADX,PRICE_CLOSE,MODE_MAIN,1));
	Range=0;
	AvgRange=0;
	for (i1=shift; i1<=shift+SSP; i1++)
		{AvgRange=AvgRange+MathAbs(High[i1]-Low[i1]);
		}
	Range=AvgRange/(SSP+1);

SsMax=High[shift]; SsMin=Low[shift];
   for (i2=shift;i2<=shift+SSP-1;i2++)
        {
         price=High[i2];
         if(SsMax<price) SsMax=price;
         price=Low[i2];
         if(SsMin>=price)  SsMin=price;
        }

smin = SsMin+(SsMax-SsMin)*K/100;
smax = SsMax-(SsMax-SsMin)*K/100;
	val1[shift]=0;
	val2[shift]=0;
	if (Close[shift]<smin)
		{
		uptrend = false;
		}
	if (Close[shift]>smax)
		{
		uptrend = true;
		}
   if (uptrend!=old && uptrend==true) {val1[shift]=Low[shift]-Range*Kstop;}
   if (uptrend!=old && uptrend==false) {val2[shift]=High[shift]+Range*Kstop;}
   old=uptrend;

}
   return(0);
  }
//+------------------------------------------------------------------+
Comments