Alternative_Ichimoku
Download script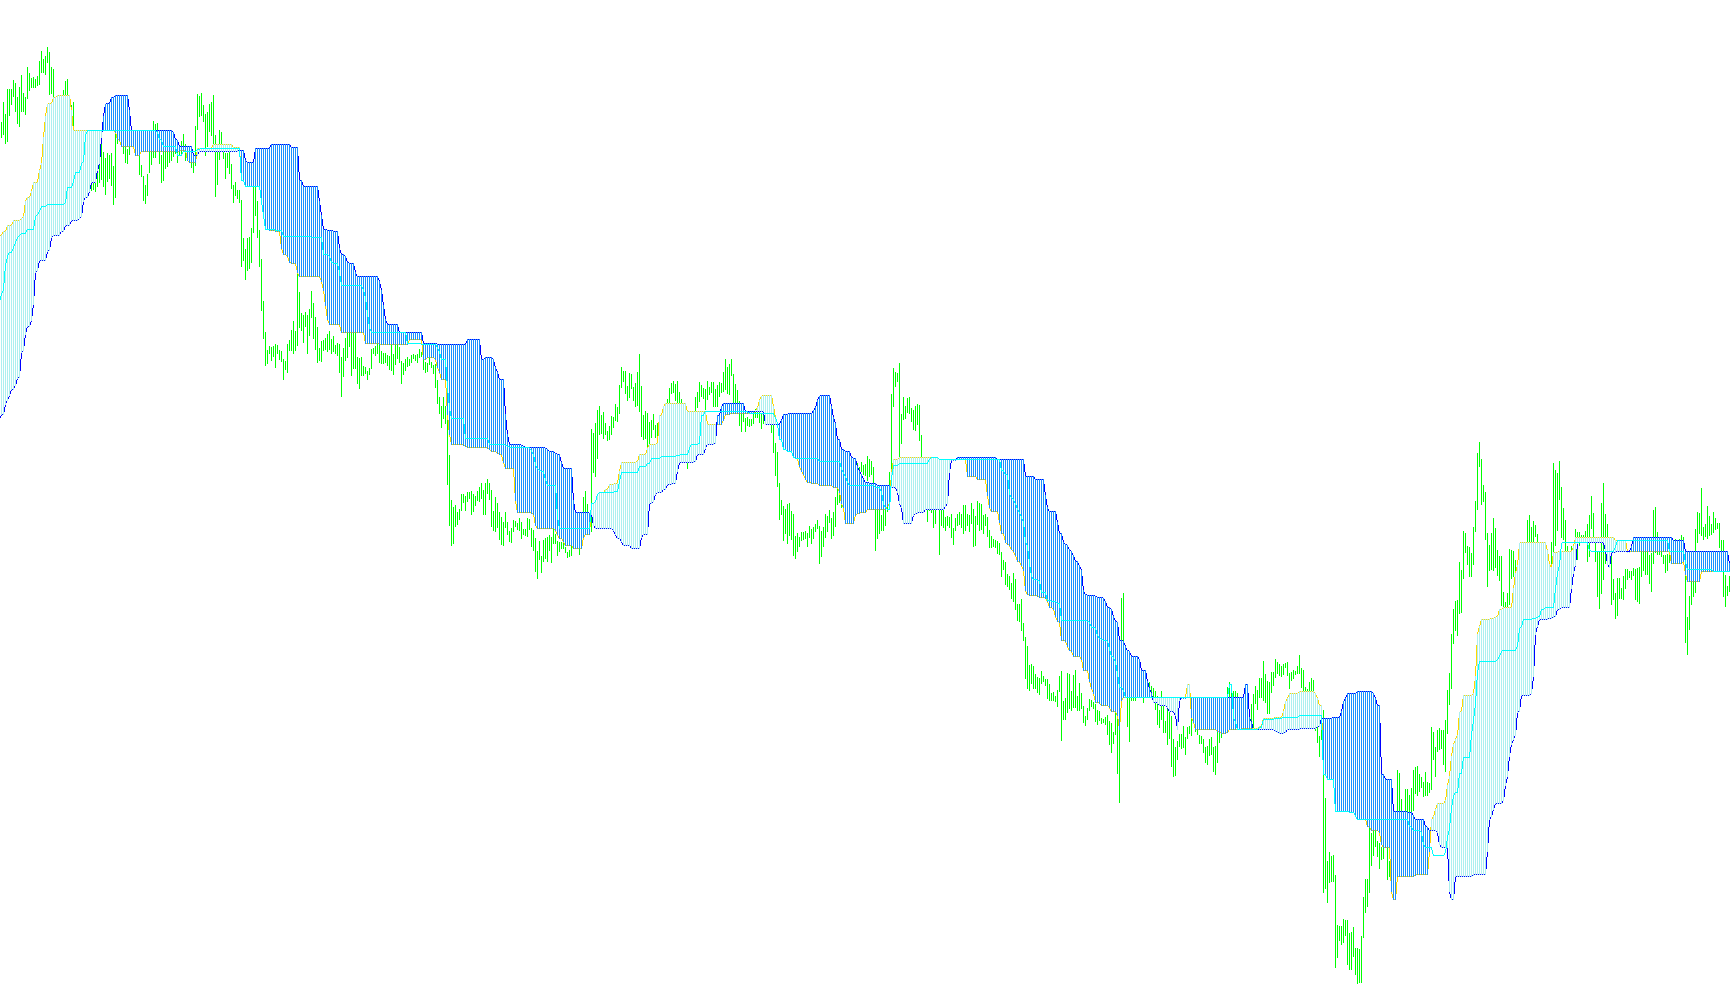
This tool is a specialized technical analysis indicator designed to help traders visualize market trends and potential reversal points by analyzing price extremes over specific timeframes. Unlike standard indicators that might only look at the most recent data, this script focuses on identifying historical highs and lows to establish "equilibrium" levels.
How the Logic Works
The indicator operates by scanning the price history to find the highest highs and lowest lows within three distinct windows of time. By calculating the midpoint between these extremes, it creates several visual markers on your chart:
1. The Primary and Delayed Trend Lines The tool calculates two main lines based on different periods:
- Priority Line: This identifies the midpoint of price action over a standard period (defined by the user as the "SSP" parameter). It represents the immediate balance of the market.
- Overdue Line: This looks further back into the past to find high and low extremes. By comparing this with the current price, it helps traders see if the market is currently stretched too far away from its historical average, potentially indicating that a correction is coming.
2. Dynamic Range Measurement The script automatically calculates the "Average Range" of the market volatility. It does this by measuring the distance between the highest and lowest prices over a significantly larger period. This value is displayed directly on your chart as a text comment, allowing you to see at a glance how much the price has moved in total points during the current trend.
3. The Stop-Order Line In addition to the trend lines, the script generates a specific "Stop-Order" line. This is calculated using a mathematical multiplier (1.62) applied to the primary period. This line acts as a structural boundary; it helps traders identify levels where a trend might lose momentum or where significant price action is likely to encounter resistance.
4. Visual Representations To make this information easy to read, the script uses different visual styles:
- Lines: Used for the primary and delayed trends to show continuous movement.
- Histograms: These provide a vertical representation of the price levels, making it easier to see how the current price relates to the calculated midpoints at a specific point in time.
Summary for the Trader
Essentially, this script takes the "noise" out of the market by highlighting the centers of gravity for different timeframes. It tells you where the price should be based on recent history (Priority Line), where it was based on older history (Overdue Line), and provides a calculated boundary (Stop-Order Line) to help you manage risk and identify when a trend is becoming overextended.
//+----------------------------------------------------------+
//|                             Alternative Ichimoku .mq4    |
//|                             Copyright © february 2007    |
//|               Lukashuk Victor Gennadievich aka lukas1    |
//+----------------------------------------------------------+
#property copyright "Copyright © 2007, lukas1"
#property link ""
//----
#property indicator_chart_window
#property indicator_buffers 5
#property indicator_color1 LightPink
#property indicator_color2 LightSteelBlue
#property indicator_color3 LightPink
#property indicator_color4 LightSteelBlue
#property indicator_width3 2
#property indicator_width4 2
#property indicator_color5 Blue
//---- input parameters
extern int SSP = 34; // áàðîâ - ðàñ÷¸òíûé ïåðèîä; calculating period
extern int SSK = 29; // çàìåäëåíèå âòîðîé ëèíèè;  tolerance of second line
//---- buffers
double ExtMapBuffer1[];
double ExtMapBuffer2[];
double Wal1[];
double Wal2[];
double ExtMapBuffer4[];
int i, i1,  i2, shift;
double SsMax, SsMin, SsMax05, SsMin05, Rsmin, Rsmax, Tsmin, Tsmax;
int val1, val2, AvgRange;
bool uptrend, old;
//----
bool gSellAlertGiven = false; // Used to stop constant alerts
bool gBuyAlertGiven  = false; // Used to stop constant alerts
string comm, st_AvgRange, st_Buy_Sell, st_text, st_level;
//+------------------------------------------------------------------+
//| Custom indicator initialization function                         |
//+------------------------------------------------------------------+
int init()
  {
//---- indicators
   IndicatorBuffers(5);
//----
   SetIndexStyle(0, DRAW_LINE);
   SetIndexBuffer(0, ExtMapBuffer1);
   SetIndexDrawBegin(0, SSP*2);
   SetIndexLabel(0,"îïåðåæàþùàÿ ëèíèÿ"); // priority line
//----
   SetIndexStyle(1, DRAW_LINE);
   SetIndexBuffer(1, ExtMapBuffer2);
   SetIndexDrawBegin(1, SSP*2);
   SetIndexLabel(1,"çàïàçäûâþùàÿ ëèíèÿ"); // overdue line
//----
   SetIndexStyle(2, DRAW_HISTOGRAM);
   SetIndexBuffer(2, Wal1);
   SetIndexDrawBegin(2, SSP*2);
//----
   SetIndexStyle(3, DRAW_HISTOGRAM);
   SetIndexBuffer(3, Wal2);
   SetIndexDrawBegin(3, SSP*2);
//----
   SetIndexStyle(4, DRAW_LINE);
   SetIndexBuffer(4, ExtMapBuffer4);
   SetIndexDrawBegin(4, SSP*2);
   SetIndexLabel(4, "ëèíèÿ ñòîï-îðäåðà"); // stop-order line
//----
   return(0);
  }
//+------------------------------------------------------------------+
//| Custor indicator deinitialization function                       |
//+------------------------------------------------------------------+
void deinit()
  {
   Comment("");
  }
//+------------------------------------------------------------------+
//| Custom indicator iteration function                              |
//+------------------------------------------------------------------+
int start()
  {
   int counted_bars = IndicatorCounted();
   if(Bars <= SSP + 1)
       return(0);
   i = Bars - SSP;
   while(i >= 0)
     {
       // maximum of previous SSP bars period
       SsMax = High[iHighest(NULL, 0, MODE_HIGH, SSP, i)];
       // minimum of previous SSP bars period
       SsMin = Low[iLowest(NULL, 0, MODE_LOW, SSP, i)];
       // maximum of SSP bars period for SSK bars from begin
       SsMax05 = High[iHighest(NULL, 0, MODE_HIGH, SSP, i + SSK)];
       // maximum of SSP bars period for SSK bars from begin
       SsMin05 = Low[iLowest(NULL, 0, MODE_LOW, SSP, i + SSK)];
       ExtMapBuffer1[i] = (SsMax + SsMin) / 2;
       ExtMapBuffer2[i] = (SsMax05+SsMin05) / 2;
       val1 = ExtMapBuffer1[1] / Point;
       val2 = ExtMapBuffer2[1] / Point;
       //----
       Rsmax = High[iHighest(NULL, 0, MODE_HIGH, SSP*2, i)];
       Rsmin = Low[iLowest(NULL, 0, MODE_LOW, SSP*2, i)];
       AvgRange = (Rsmax / Point) - (Rsmin / Point);
       Wal1[i] = ExtMapBuffer1[i];
       Wal2[i] = ExtMapBuffer2[i];
       //----
       Tsmax = High[iHighest(NULL, 0, MODE_HIGH, SSP*1.62, i)];
       Tsmin = Low[iLowest(NULL, 0, MODE_LOW, SSP*1.62, i)];
       ExtMapBuffer4[i] = (Tsmax + Tsmin) / 2;
       i--;
     }
   st_AvgRange=AvgRange;
   comm = "  âîëàòèëüíîñòü:  " + st_AvgRange + " ïóíêòîâ" + "\n";
   Comment(comm);
//----
   return(0);
  }
//+------------------------------------------------------------------+
Comments