Alternative_Ichimoku_v06
Download script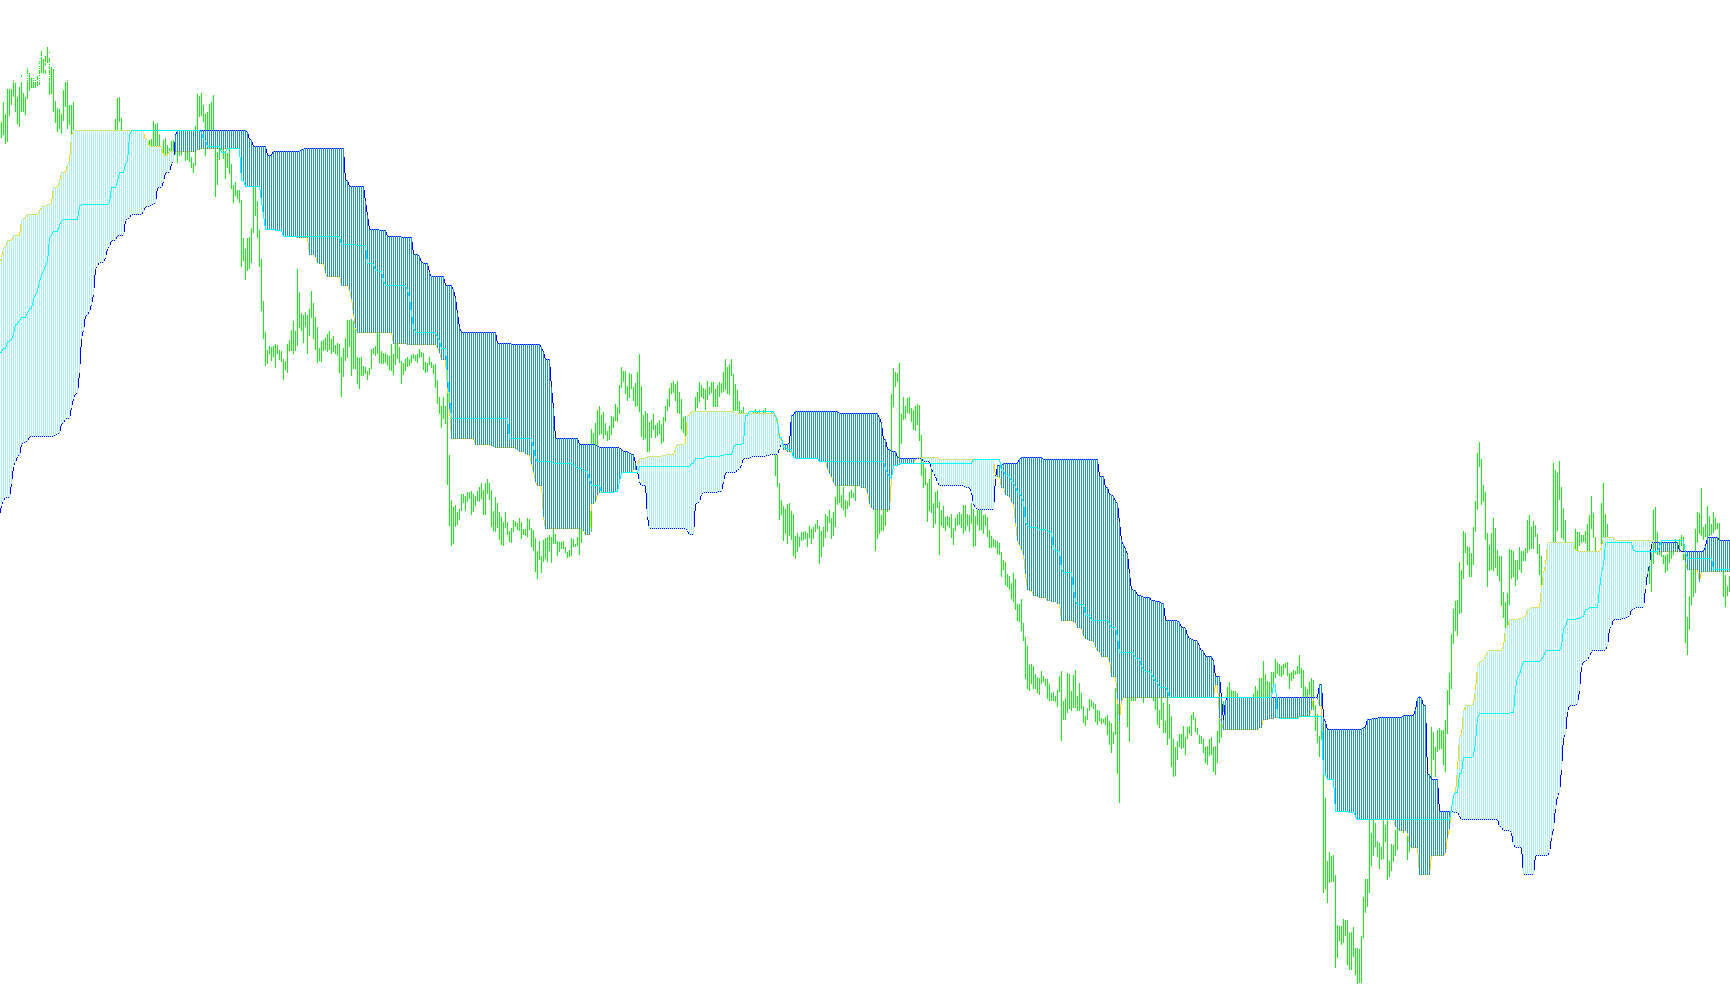
This script functions as a sophisticated visual analysis tool designed to help traders interpret market trends, volatility, and price levels by utilizing an alternative approach to the Ichimoku cloud concept. Instead of relying solely on standard averages, it focuses on identifying key price extremes over specific historical windows.
Core Visual Elements
The tool generates several distinct visual components on your chart to provide a comprehensive view of the market:
- Priority and Overdue Lines: The script calculates two primary lines based on the highest highs and lowest lows of different look-back periods. By comparing these "priority" levels with "overdue" levels, traders can visualize where the price currently sits in relation to recent historical boundaries.
- Color Clouds (Histograms): It translates the relationship between these two lines into a shaded area (a histogram). This helps identify market sentiment—when one line dominates the other, it signals whether the price is leaning toward a specific trend or reacting to old boundaries.
- Stop-Order Line: A third specific line is calculated using a modified mathematical multiplier. This acts as a reference point for potential "stop" levels or key pivot points where price action might face significant resistance or support.
Dynamic Data Analysis
Beyond the visual lines on the chart, the script performs real-time calculations to provide a "data dashboard" in the corner of your screen. It automatically detects your current timeframe (minutes, hours, days, weeks, or months) and calculates the following:
- Volatility Assessment: The tool measures the total price range covered over a significant number of bars to give you an idea of how active the market is currently.
- Period Range: It identifies the maximum price high and minimum price low for the current trading period (e.g., the high/low of the day or week).
- Distance Tracking: The script precisely calculates your "distance" from the current highs and lows. For example, it tells you exactly how many points the current market price is away from the daily maximum or minimum.
How it works for the user
In simple terms, this script takes the complexity of historical price data and simplifies it into a visual "map." It tells you where the important boundaries are (the clouds and lines), shows you how much the market is moving (volatility), and provides a live readout of exactly how far the price has traveled from its most recent peaks and valleys. This allows for a clearer understanding of whether the market is overextended, consolidating, or breaking out into new territory.
//+----------------------------------------------------------+
//|                            Alternative_Ichimoku_v06.mq4  |
//|                 Copyright © february 2007          v.06  |
//|                 Lukashuk Victor Gennadievich aka lukas1  |
//+----------------------------------------------------------+
#property copyright "Copyright © 2007, lukas1"
#property link ""
//----
#property indicator_chart_window
#property indicator_buffers 5
#property indicator_color1 LightPink
#property indicator_color2 LightSteelBlue
#property indicator_color3 LightPink
#property indicator_color4 LightSteelBlue
#property indicator_width1 2
#property indicator_width2 2
#property indicator_color5 Blue
//---- input parameters
// áàðîâ - ðàñ÷¸òíûé ïåðèîä; calculating period
extern int SSP = 48;
// çàìåäëåíèå âòîðîé ëèíèè;  tolerance of second line
extern int SSK = 52;
//---- buffers
double ExtMapBuffer1[];
double ExtMapBuffer2[];
double Wal1[];
double Wal2[];
double ExtMapBuffer4[];
int i, j;
double SsMax, SsMin, SsMax05, SsMin05, Rsmin, Rsmax, Tsmin, Tsmax;
double Day_max, Day_min;
int val1, val2, AvgRange, day_bars, day_Range, delta_from_max,
    delta_from_min, spred;
string comm, sutki;
//+------------------------------------------------------------------+
//| Custom indicator initialization function                         |
//+------------------------------------------------------------------+
int init()
  {
//---- indicators
   IndicatorBuffers(8);
//----
   SetIndexStyle(0, DRAW_LINE);
   SetIndexBuffer(0, ExtMapBuffer1);
   SetIndexDrawBegin(0, SSP*2);
   SetIndexLabel(0, "îïåðåæàþùàÿ ëèíèÿ"); // priority line
//----
   SetIndexStyle(1, DRAW_LINE);
   SetIndexBuffer(1, ExtMapBuffer2);
   SetIndexDrawBegin(1, SSP*2);
   SetIndexLabel(1, "çàïàçäûâþùàÿ ëèíèÿ"); // overdue line
//----
   SetIndexStyle(2, DRAW_HISTOGRAM);
   SetIndexBuffer(2, Wal1);
   SetIndexDrawBegin(2, SSP*2);
//----
   SetIndexStyle(3, DRAW_HISTOGRAM);
   SetIndexBuffer(3, Wal2);
   SetIndexDrawBegin(3, SSP*2);
//----
   SetIndexStyle(4, DRAW_LINE);
   SetIndexBuffer(4, ExtMapBuffer4);
   SetIndexDrawBegin(4, SSP*2);
   SetIndexLabel(4, "ëèíèÿ ñòîï-îðäåðà"); // stop-order line
//----
   return(0);
  }
//+------------------------------------------------------------------+
//| Custor indicator deinitialization function                          |
//+------------------------------------------------------------------+
void deinit()
  {
   Comment("");
  }
//+------------------------------------------------------------------+
//| Custom indicator iteration function                              |
//+------------------------------------------------------------------+
int start()
  {
   comm= "";
   int   counted_bars = IndicatorCounted();
   if(Bars <= SSP + 1)
       return(0);
   i = Bars-SSP;
   while(i >= 0)
     {
       //RefreshRates();
       // maximum of previous SSP bars period
       SsMax = High[iHighest(NULL, 0,MODE_HIGH, SSP, i)];
       // minimum of previous SSP bars period
       SsMin = Low[iLowest(NULL, 0, MODE_LOW, SSP, i)];
       // maximum of SSP bars period for SSK bars from begin
       SsMax05 = High[iHighest(NULL, 0, MODE_HIGH, SSP, i + SSK)];
       // maximum of SSP bars period for SSK bars from begin
       SsMin05 = Low[iLowest(NULL, 0, MODE_LOW, SSP, i + SSK)];
       ExtMapBuffer1[i] = (SsMax + SsMin) / 2;
       ExtMapBuffer2[i] = (SsMax05 + SsMin05) / 2;
       val1 = ExtMapBuffer1[1] / Point;
       val2 = ExtMapBuffer2[1] / Point;
       // äëÿ âîëàòèëüíîñòè
       Rsmax = High[iHighest(NULL, 0, MODE_HIGH, SSP*2, i)];
       // äëÿ âîëàòèëüíîñòè
       Rsmin = Low[iLowest(NULL, 0, MODE_LOW, SSP*2, i)];
       // ãèñòîãðàììà ðîçîâîãî îáëàêà
       Wal1[i] = ExtMapBuffer1[i];
       // ãèñòîãðàììà ãîëóáîãî îáëàêà
       Wal2[i] = ExtMapBuffer2[i];
       // ëèíèÿ ñòîï-îðäåðà
       Tsmax = High[iHighest(NULL, 0, MODE_HIGH, SSP*1.62, i)];
       // ëèíèÿ ñòîï-îðäåðà
       Tsmin = Low[iLowest(NULL, 0, MODE_LOW, SSP*1.62, i)];
       ExtMapBuffer4[i] = (Tsmax + Tsmin) / 2;
       i--;
     }
   day_bars = MathCeil(1440 / Period());
   //if (Period()==1440) day_bars=5;
   sutki = "ñóòêè";
// äåíü
   if(Period() == 1440)
     {
       sutki = "íåäåëþ";
       day_bars = 5;
     }
// íåäåëÿ
   if(Period() == 10080)
     {
       sutki = "ìåñÿö";
       day_bars = 4;
     }
// ìåñÿö
   if(Period() == 43200)
     {
       sutki = "ãîä";
       day_bars = 12;
     }
   j = SSP*2 + 1;
   while(j >= 0)
      {
        // îïðåäåëÿåì äíåâíîé äèàïàçîí
        // ëèíèÿ ìàêñ äíÿ
        Day_max = High[iHighest(NULL, 0, MODE_HIGH, day_bars, j + 1)];
        // ëèíèÿ ìèí. äíÿ
        Day_min = Low[iLowest(NULL, 0, MODE_LOW, day_bars, j + 1)];
        j--;
      }
    AvgRange = (Rsmax / Point) - (Rsmin / Point);
    day_Range = (Day_max / Point) - (Day_min / Point);
    delta_from_max = (Day_max - Bid) / Point;
    delta_from_min = (Bid - Day_min) / Point;
//----
    comm = " ïàðàìåòðû  SSP , SSK  =   " + SSP + " ,  " + SSK + " ;\n" +
           " âîëàòèëüíîñòü  (çà " + SSP*2 + " áàðîâ) :      " + AvgRange +
           "  ï.\n" + "\n" +
           " äèàïàçîí çà " + sutki + "  (çà  " + day_bars + "  áàðîâ) :   " +
           day_Range + "  ï.\n" +
           " îòêëîíåíèå îò ìàêñèìóìà çà " + sutki + ":  " + delta_from_max +
           "  ï.\n" +
           " îòêëîíåíèå îò ìèíèìóìà  çà " + sutki + ":  " + delta_from_min +
           "  ï.\n";
    Comment(comm);
//----
   return(0);
  }
//+------------------------------------------------------------------+
Comments