AltrTrend
Download script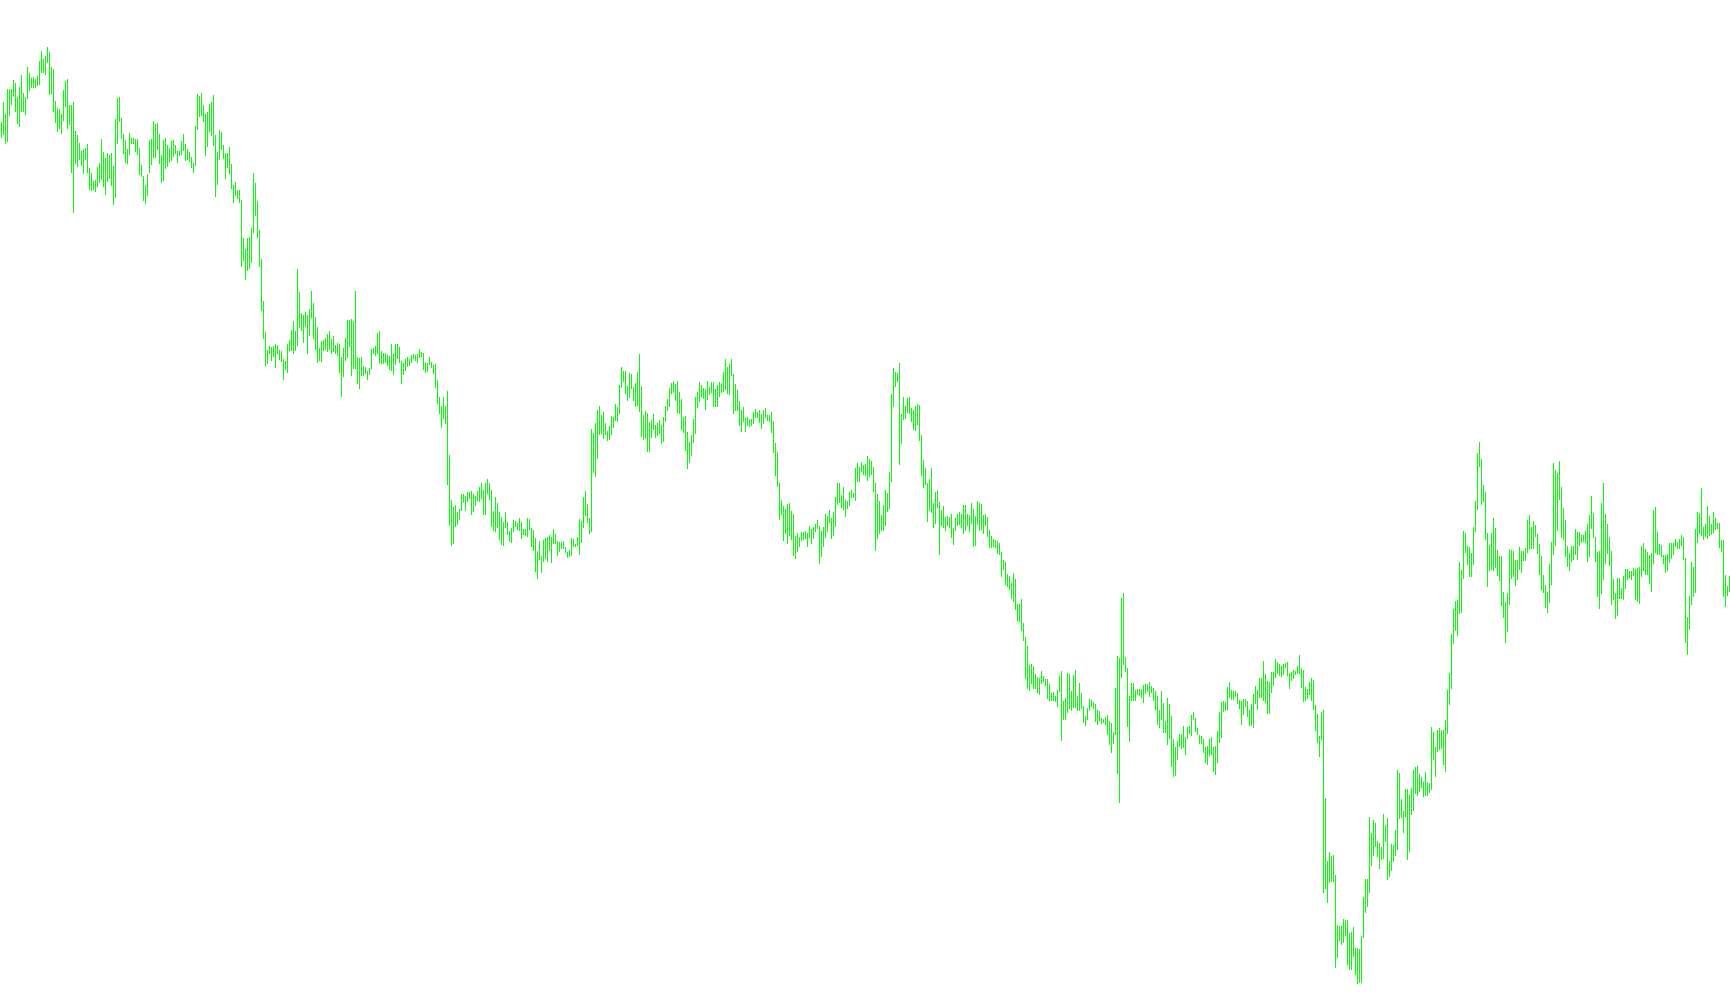
This indicator is designed to identify and visualize significant price trends by analyzing historical price movements and measuring the "strength" of the market's momentum. Instead of simply looking at where the price is moving, it attempts to determine if the current price action is breaking out of a established range or if it is staying within a consolidated zone.
Core Mechanics
1. Dynamic Range Measurement The tool begins by calculating a "look-back" period. This isn't a fixed number; instead, it uses an Average Directional Index (ADX) calculation to determine how much historical data it needs to examine. If the market is moving very strongly in one direction, the tool adjusts its focus accordingly. It calculates the average range of price candles over this specific period to establish a baseline for "normal" volatility.
2. Identifying Price Extremes Within this look-back period, the script identifies the highest high and the lowest low prices reached. By establishing these boundaries, it creates a visual "corridor" of previous price activity. It then takes these two extreme points and applies a sensitivity percentage (the K factor) to create specific entry thresholds above the recent high and below the recent low.
3. Trend Detection Logic The script constantly compares the current closing price against these calculated thresholds:
- Bearish Sentiment: If the current price closes significantly below the lower threshold of the established range, the tool identifies a downward trend.
- Bullish Sentiment: If the current price closes significantly above the upper threshold of the established range, the tool identifies an upward trend.
Visual Output
The results are displayed as a histogram on your trading chart. The script uses two distinct colors (Green and Crimson) to represent these opposing forces. When the price breaks outside the calculated "strength" zones, the indicator switches colors to signal which direction the momentum is currently favoring, helping traders distinguish between choppy, sideways markets and clear trend movements.
//+------------------------------------------------------------------+
//| AltrTrend.mq4
//| Ramdass - Conversion only
//+------------------------------------------------------------------+
#property  copyright "Author - OlegVS, GOODMAN"

#property indicator_chart_window
#property indicator_buffers 2
#property indicator_color1 Green
#property indicator_color2 Crimson


//---- input parameters
extern int K=30;
extern double Kstop=0.5;
extern int Kperiod=150;
extern int PerADX=14;
extern int CountBars=350;

//---- buffers
double val1[];
double val2[];

//+------------------------------------------------------------------+
//| Custom indicator initialization function                         |
//+------------------------------------------------------------------+
int init()
  {
   string short_name;
//---- indicator line
   IndicatorBuffers(4);
   SetIndexStyle(0,DRAW_HISTOGRAM,0,2);
   SetIndexStyle(1,DRAW_HISTOGRAM,0,2);
   SetIndexStyle(2,DRAW_HISTOGRAM,0,2);
   SetIndexStyle(3,DRAW_HISTOGRAM,0,2);
   SetIndexBuffer(0,val1);
   SetIndexBuffer(1,val2);
//----
   return(0);
  }
//+------------------------------------------------------------------+
//| AltrTrend                                                        |
//+------------------------------------------------------------------+
int start()
  {
   if (CountBars>=Bars) CountBars=Bars;
   SetIndexDrawBegin(0,Bars-CountBars+PerADX);
   SetIndexDrawBegin(1,Bars-CountBars+PerADX);
   int i,shift,counted_bars=IndicatorCounted();
   int i1,i2,x1=70,x2=30;
   double Range,AvgRange,smin,smax,SsMax,SsMin,SSP,price;
//----
   if(Bars<=PerADX+1) return(0);
//---- initial zero
   if(counted_bars<SSP+1)
   {
      for(i=1;i<=PerADX;i++) val1[CountBars-i]=0.0;
      for(i=1;i<=PerADX;i++) val2[CountBars-i]=0.0;
   }
//----


for (shift = CountBars-PerADX; shift>=0; shift--)
{

SSP=MathCeil(Kperiod/iADX(NULL,0,PerADX,PRICE_CLOSE,MODE_MAIN,1));
	Range=0;
	AvgRange=0;
	for (i1=shift; i1<=shift+SSP; i1++)
		{AvgRange=AvgRange+MathAbs(High[i1]-Low[i1]);
		}
	Range=AvgRange/(SSP+1);

SsMax=High[shift]; SsMin=Low[shift];
   for (i2=shift;i2<=shift+SSP-1;i2++)
        {
         price=High[i2];
         if(SsMax<price) SsMax=price;
         price=Low[i2];
         if(SsMin>=price)  SsMin=price;
        }

smin = SsMin+(SsMax-SsMin)*K/100;
smax = SsMax-(SsMax-SsMin)*K/100;
	val1[shift]=0;
	val2[shift]=0;
	if (Close[shift]<smin)
		{
		val1[shift]=Low[shift]; val2[shift]=High[shift];
		}
	if (Close[shift]>smax)
		{
		val1[shift]=High[shift]; val2[shift]=Low[shift];
		}

}
   return(0);
  }
//+------------------------------------------------------------------+
Comments