Alternative_Ichimoku_v06_v1
Download script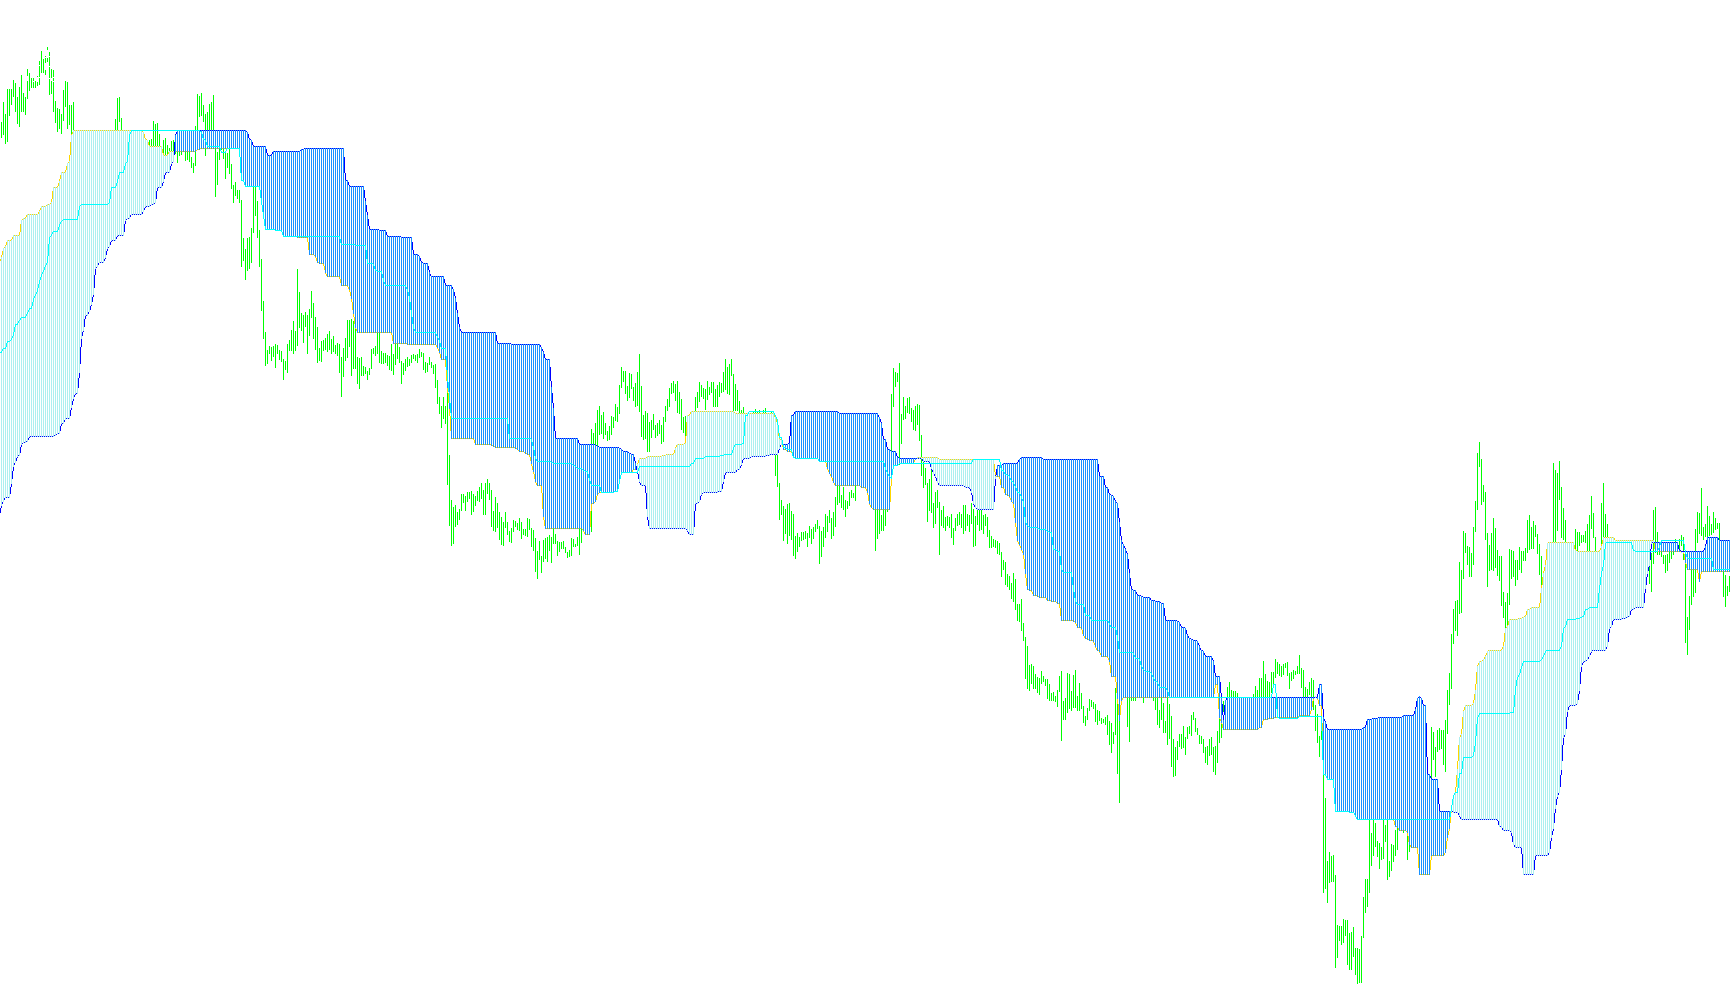
This script is a specialized technical analysis tool designed for the MetaTrader platform. It functions as a modified version of the "Ichimoku" charting system, intended to provide traders with a visual representation of price equilibrium, market momentum, and potential volatility boundaries.
Instead of traditional moving averages, this tool focuses on identifying "anchor points" based on price extremes over specific historical periods. Here is a breakdown of how the logic functions:
Core Visual Components
The indicator populates your chart with several distinct visual elements:
- Priority Line: This represents the midpoint between the highest and lowest prices reached during a standard calculation period (defined by the user). It acts as a primary reference for the current market "center."
- Overdue Line: This serves as a secondary reference point, calculating the midpoint of price extremes over a slightly different, extended historical window. By comparing this to the Priority Line, traders can see if the current price is moving faster or slower than its longer-term trend.
- Cloud Histograms: The script generates two visual "clouds" (pink and blue) based on the Priority and Overdue lines. These clouds provide a shaded area of equilibrium; when the lines move apart, it indicates expanding market volatility, and when they converge, it suggests a period of consolidation or indecision.
- Stop-Order Line: This line is calculated using an even wider historical perspective (a multiplier of the standard period). It acts as a broader boundary, often used to identify significant structural shifts in the market where price might encounter heavy resistance or support.
Dynamic Data Calculations
Beyond the visual lines, the script performs several background calculations to help the user understand the current "state" of the market:
Volatility Tracking The tool automatically measures the total range (the distance between the highest high and lowest low) over a specific number of bars. This allows you to see how much the market is "swinging" at any given moment.
Timeframe Awareness The script is intelligent enough to recognize different trading timeframes. It adjusts its calculations based on whether you are looking at minutes, hours, days, weeks, or months. It automatically reconfigures its internal math to ensure that "daily" or "weekly" ranges remain consistent regardless of which chart period you have selected.
Deviation Monitoring One of the most useful features for a trader is the script's ability to calculate "Delta." It measures exactly how far the current market price has drifted from the high and low points of the current trading day (or week/month). This provides an immediate numerical value of how "stretched" the market is, helping to identify if a price is overextended and potentially due for a correction.
Summary of Use
Essentially, this tool simplifies complex price action into four main categories: equilibrium (the lines), momentum (the cloud width), structural boundaries (the stop-order line), and real-time statistics (the data displayed on the chart). It allows a trader to see at a glance where the market is centered, how volatile it is currently behaving, and how far the current price has moved from its recent extremes.
//+----------------------------------------------------------+
//|                            Alternative_Ichimoku_v06.mq4  |
//|                 Copyright © february 2007          v.06  |
//|                 Lukashuk Victor Gennadievich aka lukas1  |
//+----------------------------------------------------------+
#property copyright "Copyright © 2007, lukas1"
#property link ""
//----
#property indicator_chart_window
#property indicator_buffers 5
#property indicator_color1 LightPink
#property indicator_color2 LightSteelBlue
#property indicator_color3 LightPink
#property indicator_color4 LightSteelBlue
#property indicator_width1 2
#property indicator_width2 2
#property indicator_color5 Blue
//---- input parameters
// bars - calculating period
extern int SSP = 48;
// tolerance of the second line
extern int SSK = 52;
//---- buffers
double ExtMapBuffer1[];
double ExtMapBuffer2[];
double Wal1[];
double Wal2[];
double ExtMapBuffer4[];
int i, j;
double SsMax, SsMin, SsMax05, SsMin05, Rsmin, Rsmax, Tsmin, Tsmax;
double Day_max, Day_min;
int val1, val2, AvgRange, day_bars, day_Range, delta_from_max,
    delta_from_min, spred;
string comm, sutki;
//+------------------------------------------------------------------+
//| Custom indicator initialization function                         |
//+------------------------------------------------------------------+
int init()
  {
//---- indicators
   IndicatorBuffers(8);
//----
   SetIndexStyle(0, DRAW_LINE);
   SetIndexBuffer(0, ExtMapBuffer1);
   SetIndexDrawBegin(0, SSP*2);
   SetIndexLabel(0, "priority line"); // priority line
//----
   SetIndexStyle(1, DRAW_LINE);
   SetIndexBuffer(1, ExtMapBuffer2);
   SetIndexDrawBegin(1, SSP*2);
   SetIndexLabel(1, "overdue line"); // overdue line
//----
   SetIndexStyle(2, DRAW_HISTOGRAM);
   SetIndexBuffer(2, Wal1);
   SetIndexDrawBegin(2, SSP*2);
//----
   SetIndexStyle(3, DRAW_HISTOGRAM);
   SetIndexBuffer(3, Wal2);
   SetIndexDrawBegin(3, SSP*2);
//----
   SetIndexStyle(4, DRAW_LINE);
   SetIndexBuffer(4, ExtMapBuffer4);
   SetIndexDrawBegin(4, SSP*2);
   SetIndexLabel(4, "stop-order lline"); // stop-order line
//----
   return(0);
  }
//+------------------------------------------------------------------+
//| Custor indicator deinitialization function                          |
//+------------------------------------------------------------------+
void deinit()
  {
   Comment("");
  }
//+------------------------------------------------------------------+
//| Custom indicator iteration function                              |
//+------------------------------------------------------------------+
int start()
  {
   comm= "";
   int   counted_bars = IndicatorCounted();
   if(Bars <= SSP + 1)
       return(0);
   i = Bars-SSP;
   while(i >= 0)
     {
       //RefreshRates();
       // maximum of previous SSP bars period
       SsMax = High[iHighest(NULL, 0,MODE_HIGH, SSP, i)];
       // minimum of previous SSP bars period
       SsMin = Low[iLowest(NULL, 0, MODE_LOW, SSP, i)];
       // maximum of SSP bars period for SSK bars from beginning
       SsMax05 = High[iHighest(NULL, 0, MODE_HIGH, SSP, i + SSK)];
       // maximum of SSP bars period for SSK bars from beginning
       SsMin05 = Low[iLowest(NULL, 0, MODE_LOW, SSP, i + SSK)];
       ExtMapBuffer1[i] = (SsMax + SsMin) / 2;
       ExtMapBuffer2[i] = (SsMax05 + SsMin05) / 2;
       val1 = ExtMapBuffer1[1] / Point;
       val2 = ExtMapBuffer2[1] / Point;
       // fro volatility
       Rsmax = High[iHighest(NULL, 0, MODE_HIGH, SSP*2, i)];
       // for volatility
       Rsmin = Low[iLowest(NULL, 0, MODE_LOW, SSP*2, i)];
       // histogram of a pink cloud
       Wal1[i] = ExtMapBuffer1[i];
       // histogram of a blue cloud
       Wal2[i] = ExtMapBuffer2[i];
       // stop-order line
       Tsmax = High[iHighest(NULL, 0, MODE_HIGH, SSP*1.62, i)];
       // stop-order line
       Tsmin = Low[iLowest(NULL, 0, MODE_LOW, SSP*1.62, i)];
       ExtMapBuffer4[i] = (Tsmax + Tsmin) / 2;
       i--;
     }
   day_bars = MathCeil(1440 / Period());
   //if (Period()==1440) day_bars=5;
   sutki = "day";
// äåíü
   if(Period() == 1440)
     {
       sutki = "week";
       day_bars = 5;
     }
// íåäåëÿ
   if(Period() == 10080)
     {
       sutki = "month";
       day_bars = 4;
     }
// ìåñÿö
   if(Period() == 43200)
     {
       sutki = "year";
       day_bars = 12;
     }
   j = SSP*2 + 1;
   while(j >= 0)
      {
        // find the daily range
        // max line of a day
        Day_max = High[iHighest(NULL, 0, MODE_HIGH, day_bars, j + 1)];
        // min line of a day
        Day_min = Low[iLowest(NULL, 0, MODE_LOW, day_bars, j + 1)];
        j--;
      }
    AvgRange = (Rsmax / Point) - (Rsmin / Point);
    day_Range = (Day_max / Point) - (Day_min / Point);
    delta_from_max = (Day_max - Bid) / Point;
    delta_from_min = (Bid - Day_min) / Point;
//----
    comm = " parameters  SSP , SSK  =   " + SSP + " ,  " + SSK + " ;\n" +
           " volatility  (for " + SSP*2 + " bars) :      " + AvgRange +
           "  ï.\n" + "\n" +
           " range for " + sutki + "  (for  " + day_bars + "  bars) :   " +
           day_Range + "  ï.\n" +
           " deviation from maximum for " + sutki + ":  " + delta_from_max +
           "  ï.\n" +
           " deviation from minimum for " + sutki + ":  " + delta_from_min +
           "  ï.\n";
    Comment(comm);
//----
   return(0);
  }
//+------------------------------------------------------------------+
Comments