Alternative_Ichimoku_v07_v1
Download script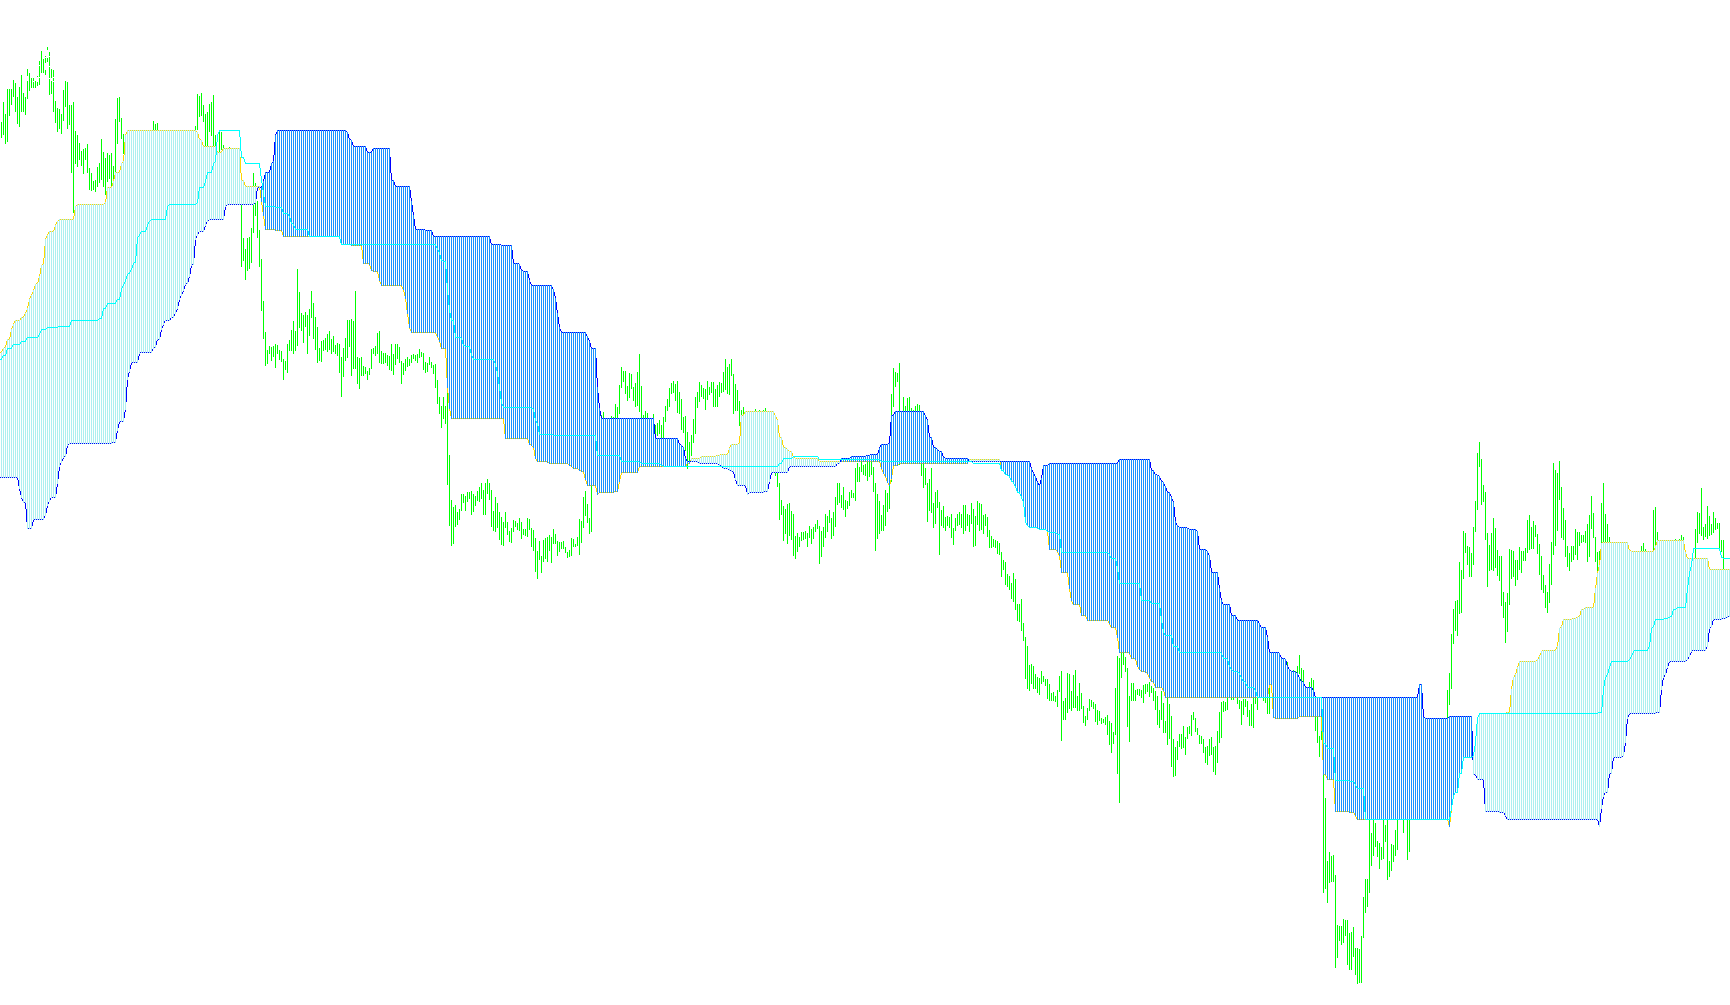
This script is a custom technical analysis tool designed to provide traders with a visual representation of price equilibrium, volatility, and significant historical boundaries. Instead of following the standard Ichimoku Cloud rules, this "Alternative" version focuses on identifying specific price zones based on high and low extremes over various timeframes.
Here is a breakdown of the logic used by the tool:
Core Price Mapping
The indicator calculates three primary lines to help define the current "fair value" or sentiment of the market:
- Priority Line & Overdue Line: The script looks back at a specific number of historical bars (defined by the user) to find the highest and lowest prices. It then calculates the midpoint of these extremes. By comparing two different look-back periods, it creates a "Primary" and an "Overdue" line. When these lines move or interact, they signal how the current price relates to recent historical highs and lows.
- Stop-Order Line: This is a separate calculation that looks at an even wider range of data (specifically 1.62 times the base period). It identifies a broader "buffer zone," which can help traders identify where major price reversals or significant "stop" levels might reside.
- Middle Line (Optional): If enabled, this calculates the average between the Priority and Overdue lines, providing a singular median point for the data.
Visual Elements
To make the data easier to read, the script uses different visual styles:
- Clouds: The tool fills the space between the priority and overdue lines with colored histograms (Pink and Blue). This creates a visual "zone" that traders can use to see where the market is currently hovering relative to its recent extremes.
- Trend Lines: These are drawn as continuous lines to show the smooth progression of these calculated midpoints over time.
Volatility and Range Analytics
Beyond the visual lines, the script performs real-time mathematical calculations to provide a data dashboard on the chart corner. It automatically detects your current timeframe (Days, Weeks, Months, or Years) and calculates the following:
- Volatility: It measures the total point range covered by a large historical window to show how "active" or "choppy" the market is currently behaving.
- Timeframe Range: It identifies the highest and lowest points of the current session (e.g., the high/low of the current day).
- Deviation Tracking: It calculates exactly how many points the current price sits away from the daily high and the daily low.
Summary for the User
Essentially, this tool takes the "noise" of price action and smooths it into distinct zones. It tells you where the price should be based on recent history (the clouds), where the major structural boundaries are (the stop-order line), and gives you a live readout of how much room is left before the price hits the day's extreme limits.
//+----------------------------------------------------------+
//|                           Alternative_Ichimoku_v07.mq4   |
//|                            Copyright © april 2007 v.07   |
//|                Lukashuk Victor Gennadievich aka lukas1   |
//+----------------------------------------------------------+
#property copyright "Copyright © 2007, lukas1"
#property link ""
//----
#property indicator_chart_window
#property indicator_buffers 6
#property indicator_color1 LightPink
#property indicator_color2 LightSteelBlue
#property indicator_color3 LightPink
#property indicator_color4 LightSteelBlue
#property indicator_width1 2
#property indicator_width2 2
#property indicator_color5 Blue
#property indicator_color6 Magenta
//---- input parameters
// bars - calculating period
extern int SSP = 75;
// tolerance of second line
extern int SSK = 75;
// do not show the middle line
extern bool Show_Middle = false;
//---- buffers
double ExtMapBuffer1[];
double ExtMapBuffer2[];
double Wal1[];
double Wal2[];
double ExtMapBuffer4[], ExtMapBuffer5[];
int i, j;
double SsMax, SsMin, SsMax05, SsMin05, Rsmin, Rsmax,
       Tsmin, Tsmax;
double Day_max, Day_min;
int val1, val2, AvgRange, day_bars, day_Range,
    delta_from_max, delta_from_min, spred;
string comm, sutki;
//+------------------------------------------------------------------+
//| Custom indicator initialization function                         |
//+------------------------------------------------------------------+
int init()
  {
//---- indicators
   IndicatorBuffers(8);
//----
   SetIndexStyle(0, DRAW_LINE);
   SetIndexBuffer(0, ExtMapBuffer1);
   SetIndexDrawBegin(0, SSP*2);
// priority line
   SetIndexLabel(0, "priority line");
//----
   SetIndexStyle(1, DRAW_LINE);
   SetIndexBuffer(1, ExtMapBuffer2);
   SetIndexDrawBegin(1, SSP*2);
// overdue line
   SetIndexLabel(1, "overdue line");
//----
   SetIndexStyle(2, DRAW_HISTOGRAM);
   SetIndexBuffer(2, Wal1);
   SetIndexDrawBegin(2,SSP*2);
//----
   SetIndexStyle(3, DRAW_HISTOGRAM);
   SetIndexBuffer(3, Wal2);
   SetIndexDrawBegin(3,SSP*2);
//----
   SetIndexStyle(4, DRAW_LINE);
   SetIndexBuffer(4, ExtMapBuffer4);
   SetIndexDrawBegin(4,SSP*2);
// stop-order line
   SetIndexLabel(4,"stop-order line");
//----
   SetIndexStyle(5, DRAW_LINE);
   SetIndexBuffer(5, ExtMapBuffer5);
   SetIndexDrawBegin(5,SSP*2);
// middle line
   SetIndexLabel(5,"middle line");
//----
   return(0);
  }
//+------------------------------------------------------------------+
//| Custor indicator deinitialization function                       |
//+------------------------------------------------------------------+
void deinit()
  {
   Comment("");
  }
//+------------------------------------------------------------------+
//| Custom indicator iteration function                              |
//+------------------------------------------------------------------+
int start()
  {
   comm= "";
   int counted_bars = IndicatorCounted();
   if(Bars <= SSP + 1)
       return(0);
   i = Bars - SSP;
   while(i >= 0)
     {
       // RefreshRates();
       // maximum of previous SSP bars period
       SsMax = High[iHighest(NULL, 0, MODE_HIGH, SSP, i)];
       // minimum of previous SSP bars period
       SsMin = Low[iLowest(NULL, 0, MODE_LOW, SSP, i)];
       // maximum of SSP bars period for SSK bars from begin
       SsMax05 = High[iHighest(NULL, 0, MODE_HIGH, SSP, i + SSK)];
       // maximum of SSP bars period for SSK bars from begin
       SsMin05 = Low[iLowest(NULL, 0, MODE_LOW, SSP, i + SSK)];
       ExtMapBuffer1[i] = (SsMax + SsMin) / 2;
       ExtMapBuffer2[i] = (SsMax05 + SsMin05) / 2;
       val1 = ExtMapBuffer1[1] / Point;
       val2 = ExtMapBuffer2[1] / Point;
       // for volatility
       Rsmax = High[iHighest(NULL, 0, MODE_HIGH, SSP*2, i)];
       // for volatility
       Rsmin = Low[iLowest(NULL, 0, MODE_LOW, SSP*2, i)];
       // histogram of a pink cloud
       Wal1[i] = ExtMapBuffer1[i];
       // histogram of a blue cloud
       Wal2[i] = ExtMapBuffer2[i];
       // stop-order line
       Tsmax = High[iHighest(NULL, 0,MODE_HIGH, SSP*1.62, i)];
       // stop-order line
       Tsmin = Low[iLowest(NULL, 0, MODE_LOW, SSP*1.62, i)];
       ExtMapBuffer4[i] = (Tsmax + Tsmin) / 2;
       //----
       if(Show_Middle)
         {
           ExtMapBuffer5[i] = ((SsMax + SsMin) / 2 +
                              (SsMax05 + SsMin05) / 2  ) / 2;
         }
       i--;
     }
   day_bars = MathCeil(1440 / Period());
   //if (Period()==1440) day_bars=5;
   sutki = "day";
   if(Period() == 1440)
     {
       sutki = "week";
       day_bars = 5;
     }  // day
   if(Period() == 10080)
     {
       sutki = "month";
       day_bars = 4;
     }  // week
   if(Period() == 43200)
     {
       sutki = "year";
       day_bars = 12;
     }  // ìåñÿö
   j = SSP*2 + 1;
   while(j >= 0)
     {
       // find the daily range
       // max line of a day
       Day_max = High[iHighest(NULL, 0,MODE_HIGH, day_bars, j + 1)];
       // min line of a day
       Day_min = Low[iLowest(NULL, 0, MODE_LOW, day_bars, j + 1)];
       j--;
     }
   AvgRange = (Rsmax / Point) - (Rsmin / Point);
   day_Range = (Day_max / Point) - (Day_min / Point);
   delta_from_max = (Day_max-Bid) / Point;
   delta_from_min = (Bid - Day_min) / Point;
//----
   comm = " parameters  SSP , SSK  =   " + SSP + " ,  " + SSK + " ;\n" +
          " volatility  (for " + SSP*2 + " bars) :      " +
          AvgRange + "  ï.\n" + "\n" +
          " range for " + sutki + "  (for  " + day_bars +
          "  bars) :   " + day_Range + "  ï.\n" +
          " deviation from maximum for " + sutki + ":  " +
          delta_from_max + "  ï.\n" +
          " deviation from minimum for " + sutki + ":  " +
          delta_from_min + "  ï.\n";
   Comment(comm);
//----
   return(0);
  }
//+------------------------------------------------------------------+
Comments