Alternative Ichimoku
Download script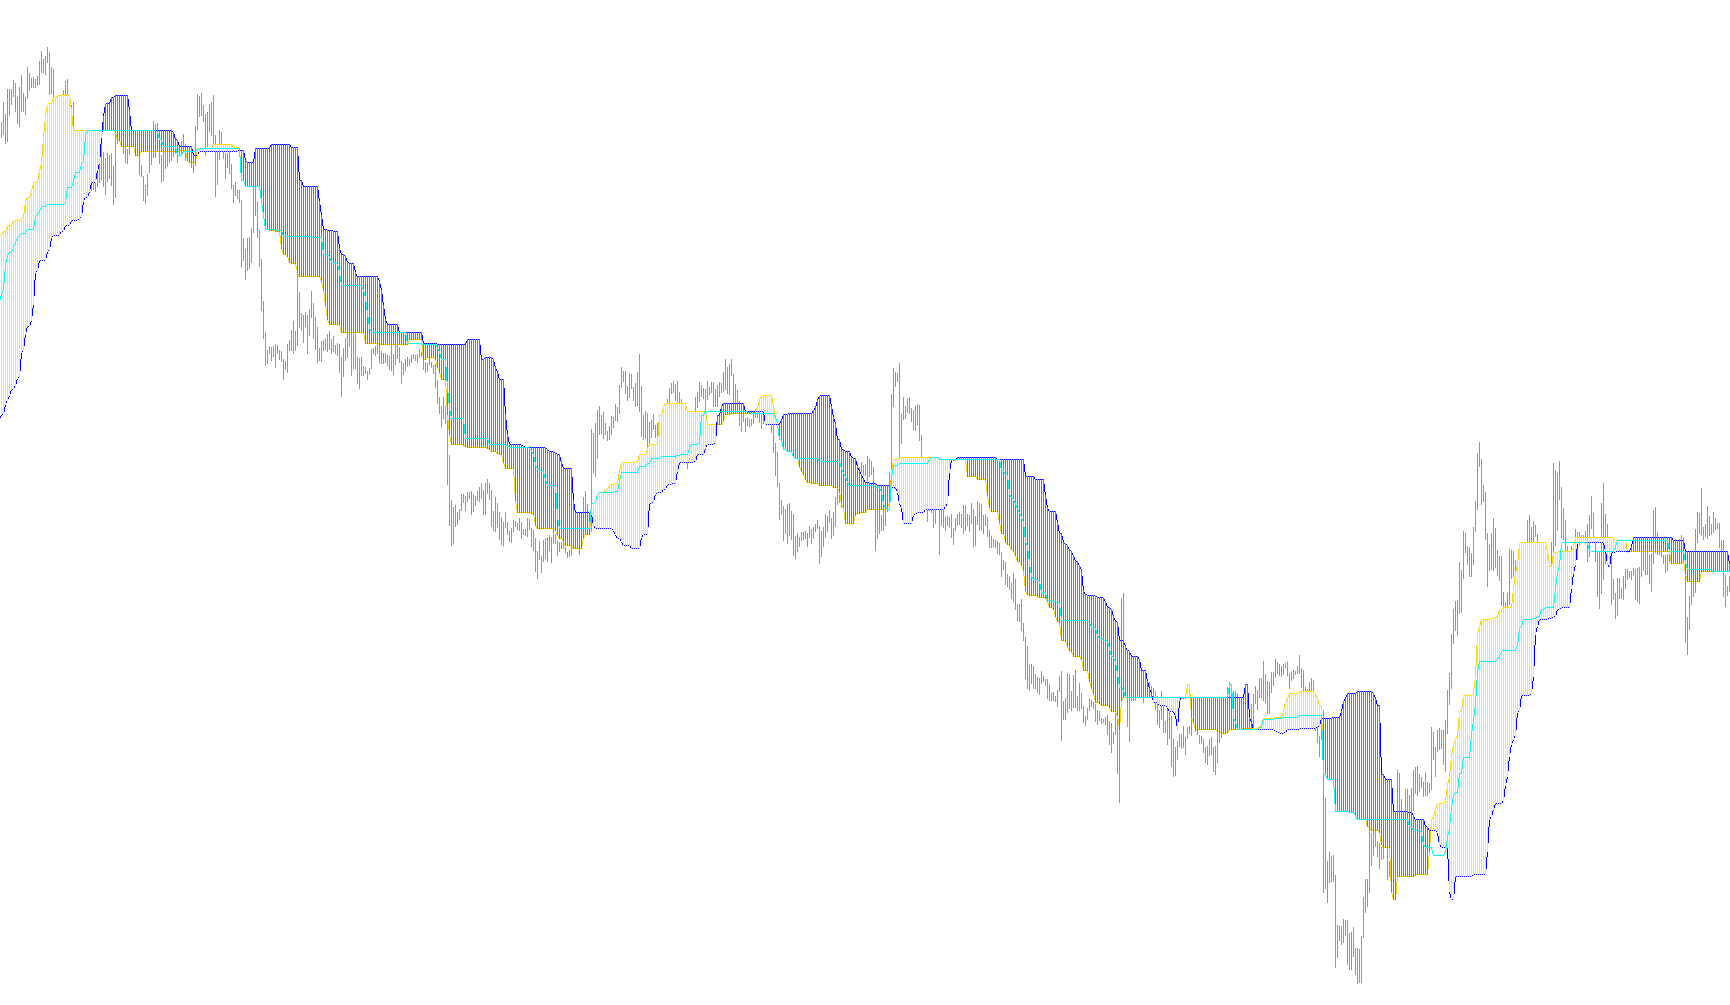
This script is a specialized technical analysis tool designed to help traders visualize market trends, volatility, and potential price boundaries. It builds upon the concepts of the traditional Ichimoku cloud but introduces unique variations to identify specific price priorities and historical levels.
Core Logic and Visualization
The script identifies and plots four distinct types of data on your trading chart to provide a comprehensive view of market behavior:
1. Priority and Overdue Price Levels The tool calculates two primary lines based on the highest highs and lowest lows within specific timeframes.
- The Priority Line acts as a central equilibrium point for the current recent price action.
- The Overdue Line looks back slightly further into history to establish a secondary reference point. By comparing these two, traders can see whether the current price momentum is staying aligned with immediate trends or if it is drifting away from historical averages.
2. Trend Histograms Instead of simple lines, the script uses histograms to represent the relationship between these priority levels. These visual elements help quickly identify the "strength" of the current trend by showing the distance between different price equilibrium points.
3. The Stop-Order Line The script calculates a third significant level based on an expanded timeframe (roughly 162% of the standard calculation period). This "Stop-Order Line" serves as a broader boundary, helping traders identify deeper structural support and resistance levels where major trend reversals might occur.
4. Real-Time Volatility Tracking Beyond just drawing lines, the script performs continuous calculations to monitor market "noise." It measures the total range (the distance between the highest high and lowest low) over a significant period. This value is displayed directly on your screen as a volatility reading in points.
How it helps the trader
Instead of looking at raw price action alone, this tool provides a multi-layered perspective:
- Context: It tells you where the price "should" be based on recent history (Priority vs. Overdue).
- Boundaries: It highlights wider structural zones (Stop-Order Line) to help manage risk.
- Environment: It provides a constant pulse on market volatility, allowing you to see at a glance if the market is moving calmly or experiencing high-intensity swings.
//+----------------------------------------------------------+
//|                             Alternative Ichimoku .mq4    |
//|                             Copyright © february 2007    |
//|               Lukashuk Victor Gennadievich aka lukas1    |
//+----------------------------------------------------------+
#property copyright "Copyright © 2007, lukas1"
#property link ""
//----
#property indicator_chart_window
#property indicator_buffers 5
#property indicator_color1 LightPink
#property indicator_color2 LightSteelBlue
#property indicator_color3 LightPink
#property indicator_color4 LightSteelBlue
#property indicator_width3 2
#property indicator_width4 2
#property indicator_color5 Blue
//---- input parameters
extern int SSP = 34; // bars - calculating period
extern int SSK = 29; // tolerance of second line
//---- buffers
double ExtMapBuffer1[];
double ExtMapBuffer2[];
double Wal1[];
double Wal2[];
double ExtMapBuffer4[];
int i, i1,  i2, shift;
double SsMax, SsMin, SsMax05, SsMin05, Rsmin, Rsmax, Tsmin, Tsmax;
int val1, val2, AvgRange;
bool uptrend, old;
//----
bool gSellAlertGiven = false; // Used to stop constant alerts
bool gBuyAlertGiven  = false; // Used to stop constant alerts
string comm, st_AvgRange, st_Buy_Sell, st_text, st_level;
//+------------------------------------------------------------------+
//| Custom indicator initialization function                         |
//+------------------------------------------------------------------+
int init()
  {
//---- indicators
   IndicatorBuffers(5);
//----
   SetIndexStyle(0, DRAW_LINE);
   SetIndexBuffer(0, ExtMapBuffer1);
   SetIndexDrawBegin(0, SSP*2);
   SetIndexLabel(0,"priority line"); // priority line
//----
   SetIndexStyle(1, DRAW_LINE);
   SetIndexBuffer(1, ExtMapBuffer2);
   SetIndexDrawBegin(1, SSP*2);
   SetIndexLabel(1,"overdue line"); // overdue line
//----
   SetIndexStyle(2, DRAW_HISTOGRAM);
   SetIndexBuffer(2, Wal1);
   SetIndexDrawBegin(2, SSP*2);
//----
   SetIndexStyle(3, DRAW_HISTOGRAM);
   SetIndexBuffer(3, Wal2);
   SetIndexDrawBegin(3, SSP*2);
//----
   SetIndexStyle(4, DRAW_LINE);
   SetIndexBuffer(4, ExtMapBuffer4);
   SetIndexDrawBegin(4, SSP*2);
   SetIndexLabel(4, "stop-order line"); // stop-order line
//----
   return(0);
  }
//+------------------------------------------------------------------+
//| Custor indicator deinitialization function                       |
//+------------------------------------------------------------------+
void deinit()
  {
   Comment("");
  }
//+------------------------------------------------------------------+
//| Custom indicator iteration function                              |
//+------------------------------------------------------------------+
int start()
  {
   int counted_bars = IndicatorCounted();
   if(Bars <= SSP + 1)
       return(0);
   i = Bars - SSP;
   while(i >= 0)
     {
       // maximum of previous SSP bars period
       SsMax = High[iHighest(NULL, 0, MODE_HIGH, SSP, i)];
       // minimum of previous SSP bars period
       SsMin = Low[iLowest(NULL, 0, MODE_LOW, SSP, i)];
       // maximum of SSP bars period for SSK bars from begin
       SsMax05 = High[iHighest(NULL, 0, MODE_HIGH, SSP, i + SSK)];
       // maximum of SSP bars period for SSK bars from begin
       SsMin05 = Low[iLowest(NULL, 0, MODE_LOW, SSP, i + SSK)];
       ExtMapBuffer1[i] = (SsMax + SsMin) / 2;
       ExtMapBuffer2[i] = (SsMax05+SsMin05) / 2;
       val1 = ExtMapBuffer1[1] / Point;
       val2 = ExtMapBuffer2[1] / Point;
       //----
       Rsmax = High[iHighest(NULL, 0, MODE_HIGH, SSP*2, i)];
       Rsmin = Low[iLowest(NULL, 0, MODE_LOW, SSP*2, i)];
       AvgRange = (Rsmax / Point) - (Rsmin / Point);
       Wal1[i] = ExtMapBuffer1[i];
       Wal2[i] = ExtMapBuffer2[i];
       //----
       Tsmax = High[iHighest(NULL, 0, MODE_HIGH, SSP*1.62, i)];
       Tsmin = Low[iLowest(NULL, 0, MODE_LOW, SSP*1.62, i)];
       ExtMapBuffer4[i] = (Tsmax + Tsmin) / 2;
       i--;
     }
   st_AvgRange=AvgRange;
   comm = "  volatility:  " + st_AvgRange + " points" + "\n";
   Comment(comm);
//----
   return(0);
  }
//+------------------------------------------------------------------+
Comments