AMA_002
Download script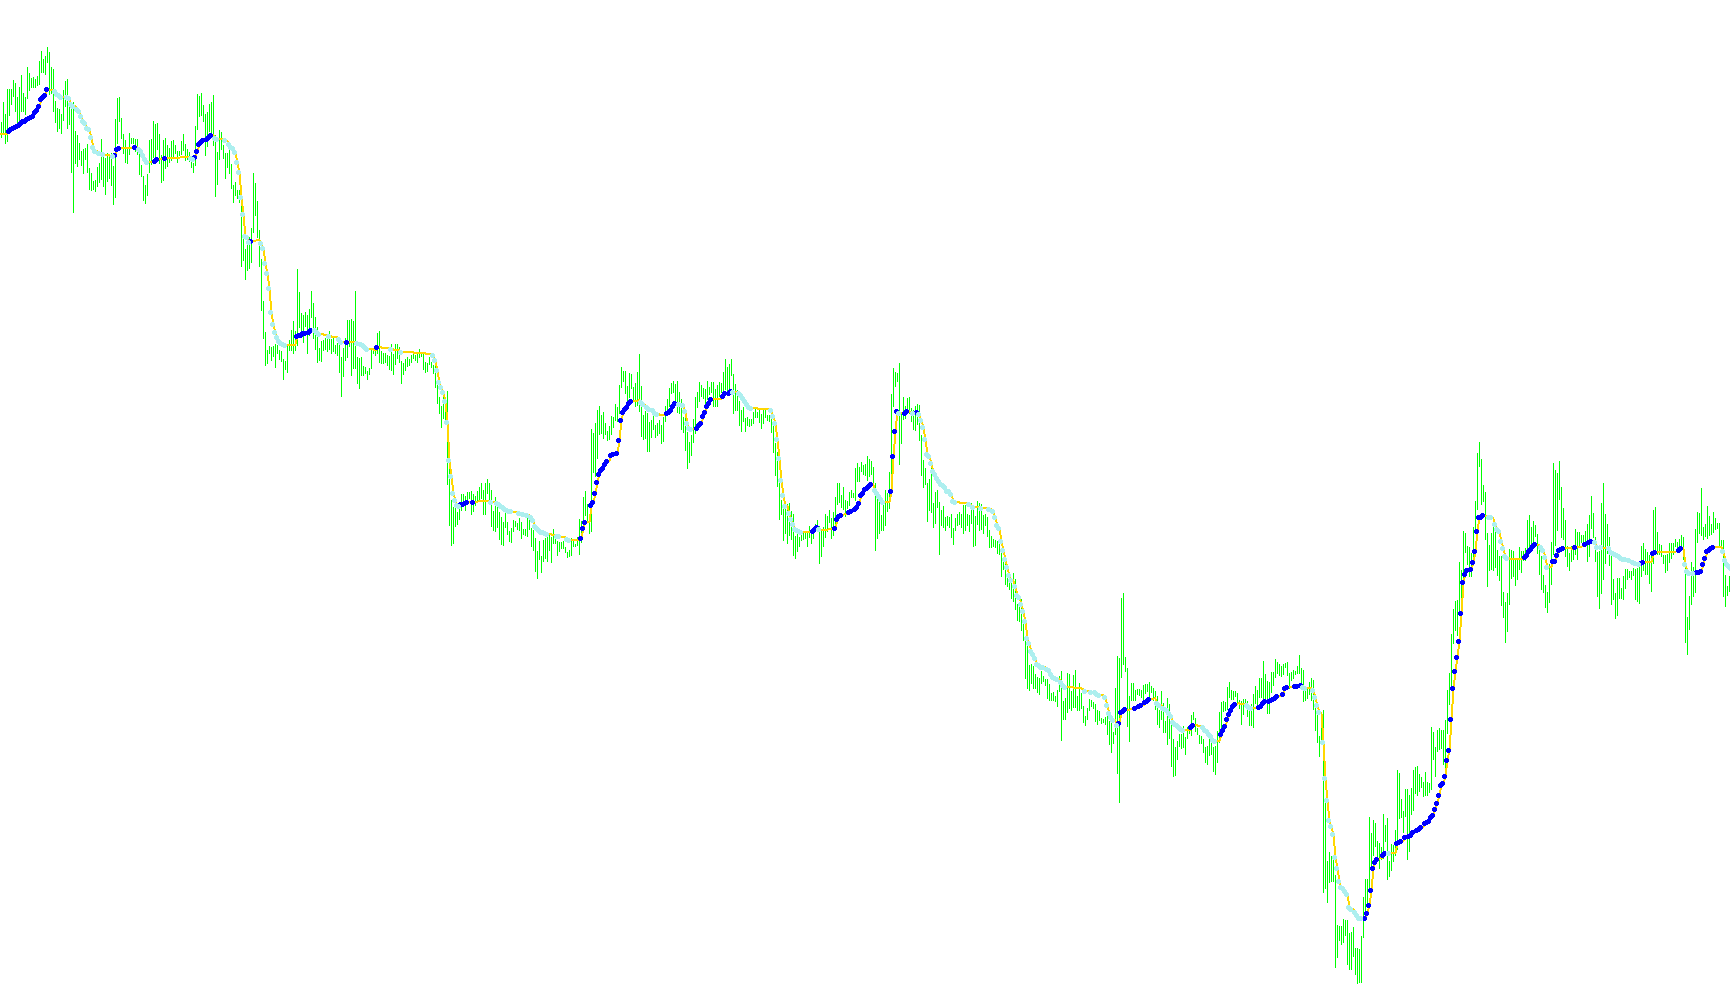
This tool is designed to provide traders with a smoother, more responsive visual representation of market price trends compared to standard moving averages. Its primary goal is to filter out "market noise"—those small, insignificant price fluctuations—to help identify the true underlying direction of the asset.
How it Works
The logic operates by analyzing the relationship between current price movements and historical volatility. Instead of simply averaging prices over a set timeframe, it performs the following steps:
- Volatility Analysis: The script calculates a "noise" factor by looking at the magnitude of price changes over a specific period. It then compares this to the actual movement of the price.
- Dynamic Adaptation: By calculating an Error Ratio (ER), the tool determines how much of the current price movement is genuine trend progression versus random fluctuation. This allows the indicator to react quickly to significant breakouts while remaining steady during periods of consolidation.
- Smoothing Mechanism: It utilizes a sophisticated mathematical power function to blend the current price with its previous values. This ensures that the resulting line flows smoothly across the chart, making it easier for the human eye to follow the trend without being distracted by jagged "sawtooth" movements.
Visual Signals and Alerts
Beyond simply drawing a trend line on your chart, this script provides specific visual cues to highlight momentum shifts:
- The Trend Line: A primary continuous line (colored in Sienna) serves as your main guide for the asset's current direction.
- Buy/Sell Signals: The tool identifies specific "turning points." When the trend line moves significantly upward or downward beyond a user-defined threshold, the script places specific markers (arrows) on the chart.
- Upward Momentum: When the indicator detects a significant positive shift, it marks the point to suggest bullish strength.
- Downward Momentum: When the indicator detects a significant negative shift, it marks the point to suggest bearish pressure.
Summary for the Trader
In short, this script acts as a "smart filter." It tries to ignore the "static" of the market and provides you with a clean line representing the trend. When the price moves strongly enough to overcome that filtered noise, the tool highlights those moments with arrows, helping you identify potential entry or exit points more clearly than by looking at raw price data alone.
//+------------------------------------------------------------------+
//|                                                          AMA.mq4 |
//|                      Copyright © 2004, MetaQuotes Software Corp. |
//|                                        http://www.metaquotes.net |
//+------------------------------------------------------------------+
#property copyright "Copyright © 2004, by konKop,wellx"
#property link      "http://www.metaquotes.net"

#property indicator_chart_window
#property indicator_buffers 3
#property indicator_color1 Sienna
#property indicator_color2 DeepSkyBlue
#property indicator_color3 Gold

//---- input parameters
extern int       periodAMA=9;
extern int       nfast=2;
extern int       nslow=30;
extern double    G=2.0;
extern double    dK=2.0;

//---- buffers
double kAMAbuffer[];
double kAMAupsig[];
double kAMAdownsig[];

//+------------------------------------------------------------------+

int    cbars=0, prevbars=0, prevtime=0;

double slowSC,fastSC;

//+------------------------------------------------------------------+
//| Custom indicator initialization function                         |
//+------------------------------------------------------------------+
int init()
  {
//---- indicators
   SetIndexStyle(0,DRAW_LINE,0,2);
   SetIndexStyle(1,DRAW_ARROW);
   SetIndexArrow(1,159);
   SetIndexStyle(2,DRAW_ARROW);
   SetIndexArrow(2,159);
   //SetIndexDrawBegin(0,nslow+nfast);
   SetIndexBuffer(0,kAMAbuffer);
   SetIndexBuffer(1,kAMAupsig);
   SetIndexBuffer(2,kAMAdownsig);


   IndicatorDigits(4);

   //slowSC=0.064516;
   //fastSC=0.2;
   //cbars=IndicatorCounted();
//----
   return(0);
  }
//+------------------------------------------------------------------+
//| Custom indicator deinitialization function                       |
//+------------------------------------------------------------------+
int deinit()
  {
   return(0);
  }
//+------------------------------------------------------------------+
//| Custom indicator iteration function                              |
//+------------------------------------------------------------------+
int start()
  {
   int    i,pos=0;
   double noise=0.000000001,AMA,AMA0,signal,ER;
   double dSC,ERSC,SSC,ddK;

   if (prevbars==Bars) return(0);

//---- TODO: add your code here
   slowSC=(2.0 /(nslow+1));
   fastSC=(2.0 /(nfast+1));
   cbars=IndicatorCounted();
   if (Bars<=(periodAMA+2)) return(0);
//---- check for possible errors
   if (cbars<0) return(-1);
//---- last counted bar will be recounted
   if (cbars>0) cbars--;
   pos=Bars-periodAMA-2;
   AMA0=Close[pos+1];
   while (pos>=0)
     {
      if(pos==Bars-periodAMA-2) AMA0=Close[pos+1];
      signal=MathAbs(Close[pos]-Close[pos+periodAMA]);
      noise=0.000000001;
      for(i=0;i<periodAMA;i++)
       {
        noise=noise+MathAbs(Close[pos+i]-Close[pos+i+1]);
       }
      ER =signal/noise;
      dSC=(fastSC-slowSC);
      ERSC=ER*dSC;
      SSC=ERSC+slowSC;
      AMA=AMA0+(MathPow(SSC,G)*(Close[pos]-AMA0));
      kAMAbuffer[pos]=AMA;

      ddK=(AMA-AMA0);
      if ((MathAbs(ddK)) > (dK*Point) && (ddK > 0)) kAMAupsig[pos] =AMA; else kAMAupsig[pos]=0;
      if ((MathAbs(ddK)) > (dK*Point) && (ddK < 0)) kAMAdownsig[pos]=AMA; else kAMAdownsig[pos]=0;


      AMA0=AMA;
      pos--;
     }
//----
   prevbars=Bars;
   return(0);
  }
Comments