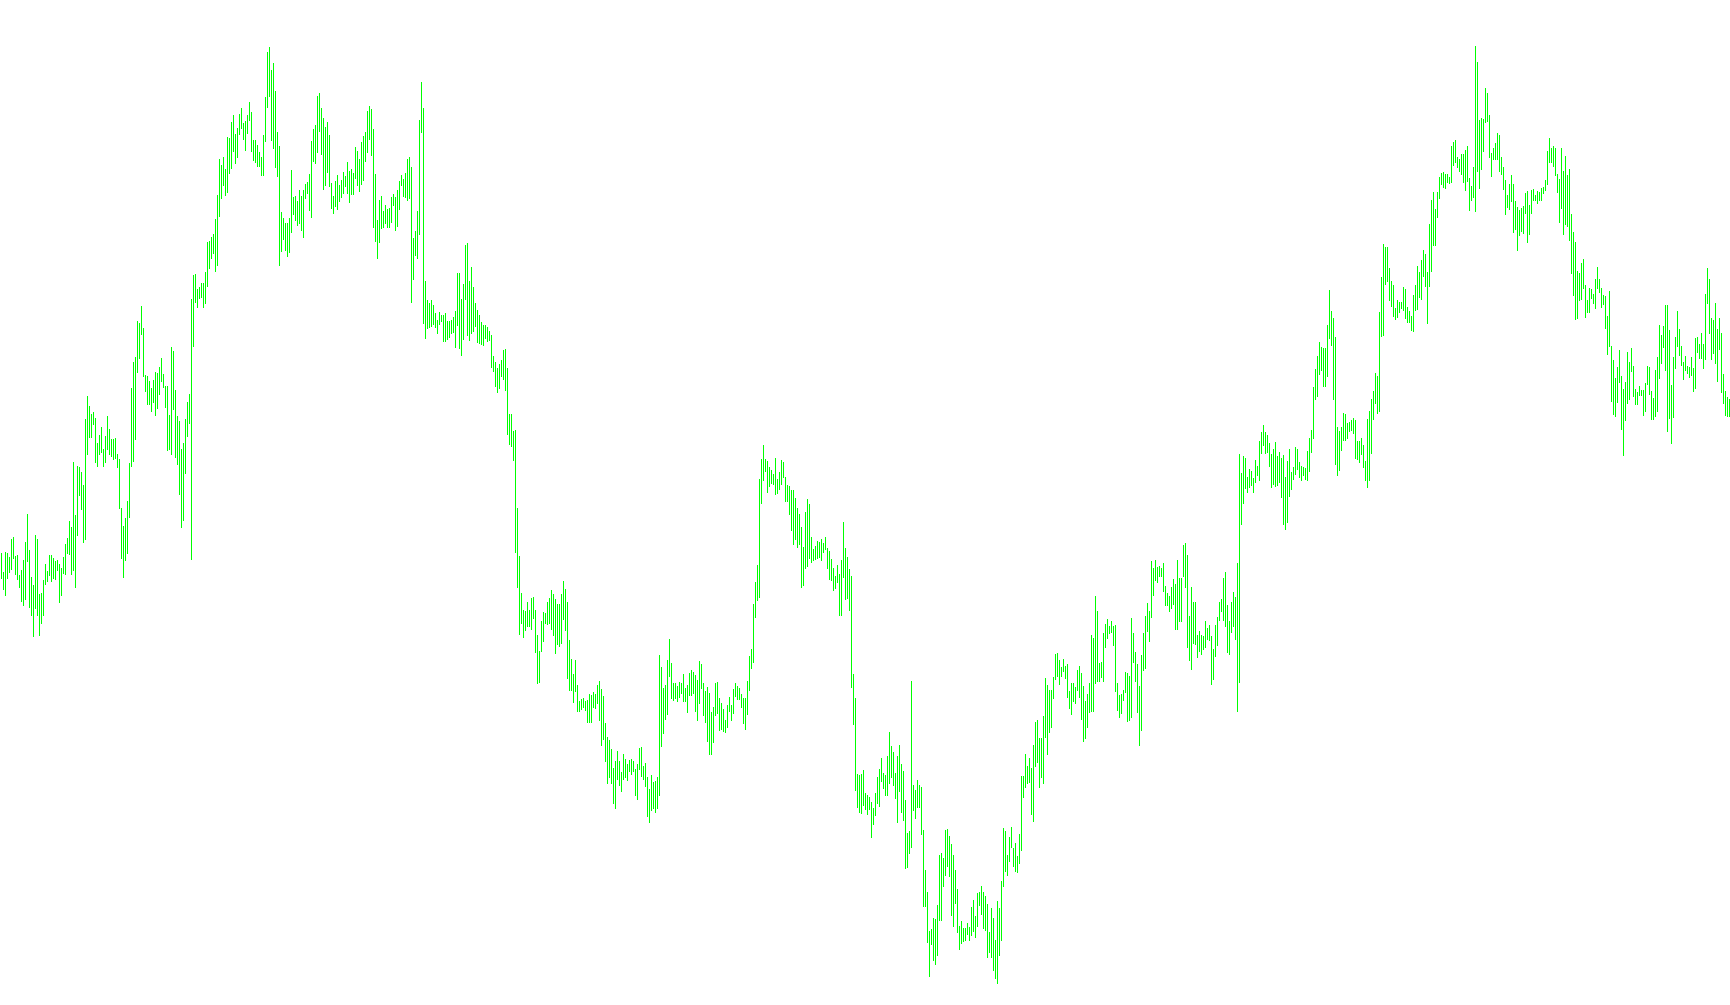
This technical script is designed to identify specific visual markers on a trading chart to help traders spot potential market movements. Rather than providing constant data or lines, the tool functions as an automated "scanner" that places a distinct red arrow on the chart when specific price action conditions are met.
How the Logic Works
The script operates by scanning the historical price data of the currency pair or asset you are currently viewing. Here is the step-by-step logic it uses to determine where to place its markers:
1. Scanning Price Range The tool looks at each individual "candle" (the standard unit of time on your chart). It calculates the distance between the highest point and the lowest point of the previous candle to understand the immediate volatility of the market.
2. Identifying Significant Peaks The core logic relies on a "look-back" mechanism. The script examines a window of the last 50 candles to determine if the current price is reaching a significant peak. It specifically looks for instances where the highest price point reached in that 50-candle period matches the high of the previous candle.
3. Visual Execution When the script confirms that a new "high" has been established within this 50-bar timeframe, it triggers a visual signal. It places a red arrow at the exact high price of that candle.
Summary for the Trader
In simple terms, this tool acts as a Peak Detector. It monitors the price action to highlight moments where the market is hitting new highs relative to the recent past. By marking these specific points with an arrow, it allows you to visually identify areas of significant resistance or "price ceilings" where the market has recently reached its highest extent over a 50-period window.
/*-----------------------------+
|			       |
| Shared by www.Aptrafx.com    |
|			       |
+------------------------------*/


#property indicator_chart_window
#property indicator_buffers 1
#property indicator_color1 Red

double BufferBuy[];

int init()
{
   IndicatorBuffers(1);
   SetIndexStyle(0,DRAW_ARROW);
   SetIndexBuffer(0,BufferBuy);
   SetIndexArrow(0,181);
   SetIndexEmptyValue(0,0.0);
   ArraySetAsSeries(BufferBuy,true);

   return(0);
}

int deinit()
{
   return(0);
}

int start()
{
   int i,TotalBars, CountedBars;
   double LastBarsRange,Bottom20;

   CountedBars=IndicatorCounted();

   TotalBars=Bars-CountedBars;

   for(i=TotalBars-1;i>=0;i--)
   {
      LastBarsRange=(High[i+1]-Low[i+1]);
      Bottom20=Low[i+1]+(LastBarsRange*0.20);


         if(Highest(Symbol(),0,MODE_HIGH,50,1)==1)
            BufferBuy[i]=High[i];


}
}
Comments