WCCI
Download script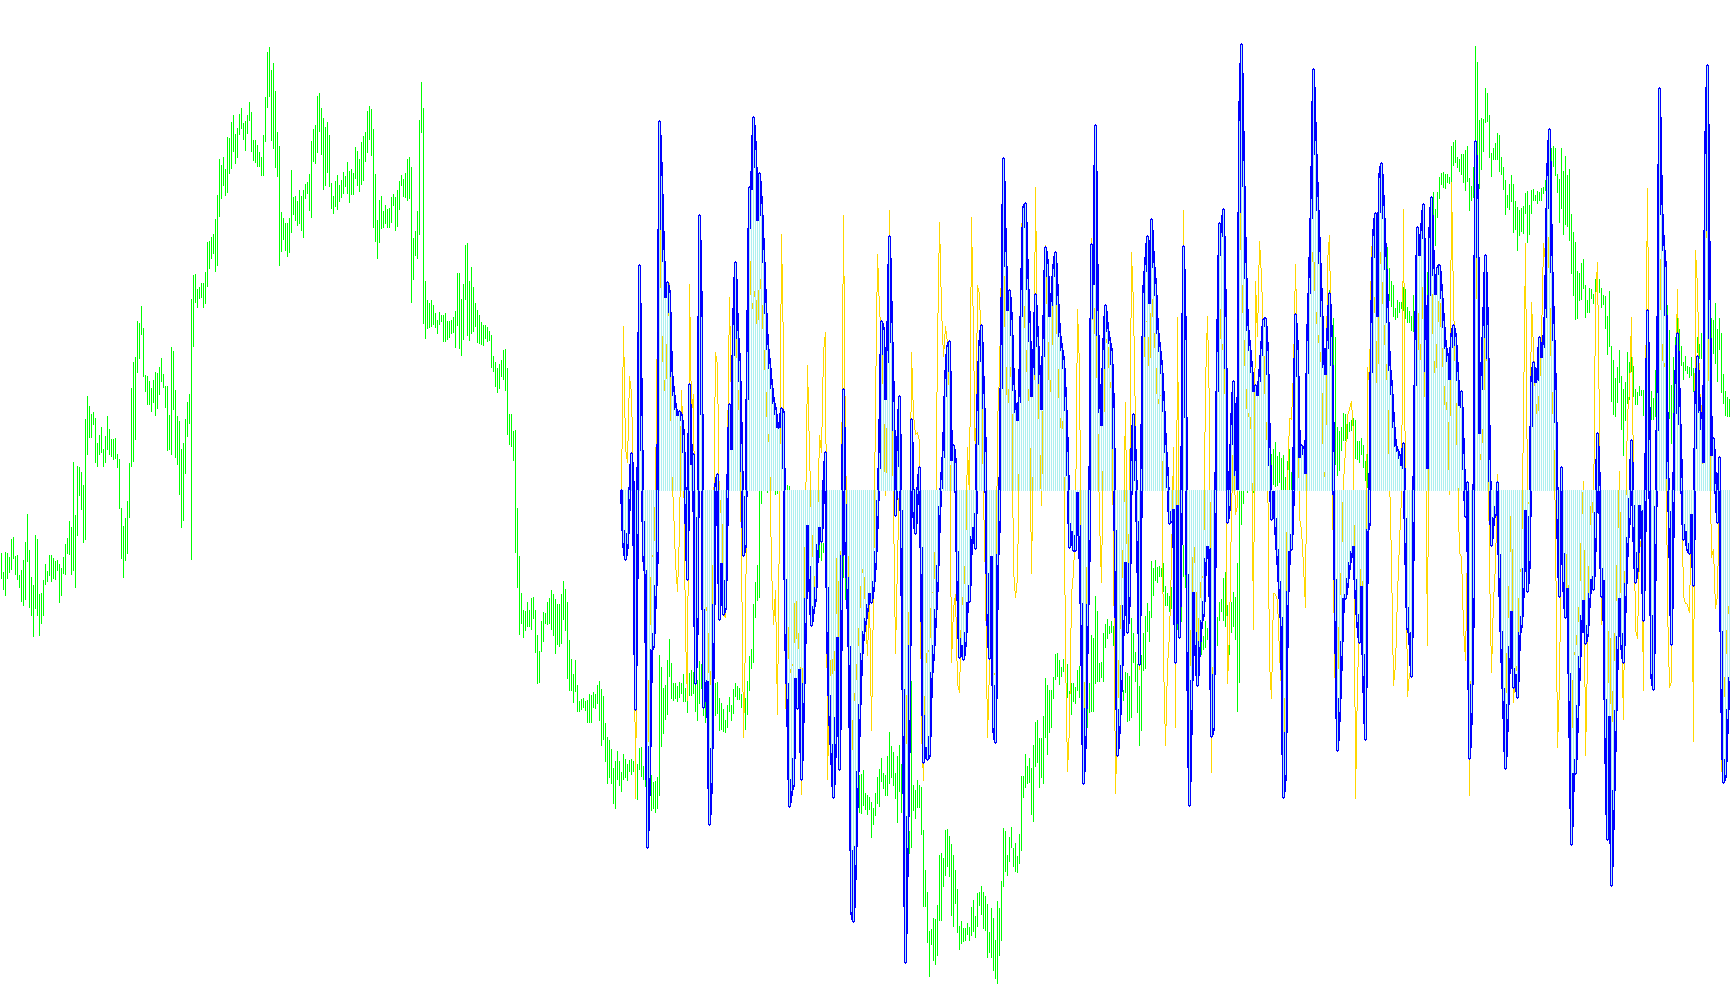
This tool is a specialized technical analysis indicator designed to help traders visualize market momentum and trends by comparing two different speeds of price movement. It operates in a separate window on your trading platform, providing three distinct visual components: a fast trend line, a slow trend line, and a difference histogram.
Core Logic and Mechanics
The primary logic of this script revolves around the Commodity Channel Index (CCI), a standard market momentum oscillator. Rather than showing just one perspective of the market, this indicator processes the data in two distinct layers to help filter out "noise" from significant trends:
- The Fast Component: The script calculates a rapid CCI based on a short timeframe (defined by a smaller period). This reflects immediate price fluctuations and quick movements.
- The Slow Component: Simultaneously, it calculates a slower CCI based on a longer timeframe (a larger period). This represents the broader, underlying trend of the market.
- The Histogram: The tool then calculates the mathematical difference between these two components. This creates a visual "history" or histogram that highlights the gap between short-term momentum and long-term trends.
How it Works for the User
When you apply this to a chart, the logic performs the following automated steps:
- Data Synchronization: The script continuously monitors new price candles. It is designed to automatically update as the market moves, ensuring that the visual lines stay current with live pricing.
- Dynamic Recalculation: If you change any of the primary settings (such as the periods or the amount of historical data displayed), the script detects this change and instantly recalculates the entire history so the visual remains accurate.
- Visual Comparison: By plotting both the fast and slow lines together, the logic allows you to see when short-term price action is deviating from the long-term average. The histogram serves as a secondary confirmation; it visually expands or contracts depending on how much the "fast" price is pulling away from the "slow" price.
Summary of Purpose
Essentially, this script is built to help you identify momentum shifts. By comparing a fast moving average against a slow moving average via the CCI method, it provides a clearer picture of whether the current market movement is a significant trend or merely a temporary fluctuation.
//+------------------------------------------------------------------+
//|                                                   WoodiesCCI.mq4 |
//|                                                             Rosh |
//|                                        http://www.metaquotes.net |
//+------------------------------------------------------------------+
#property copyright "created by Luis Damiani; converted by Rosh"
#property link      "http://www.metaquotes.net"

#property indicator_separate_window
#property indicator_buffers 3
#property indicator_color1 Red
#property indicator_color2 DeepSkyBlue
#property indicator_color3 DimGray
//---- input parameters
extern int       A_period=14;
extern int       B_period=6;
extern int       num_bars=550;
// parameters
int shift=0;
bool initDone=true; // áûëî init
int bar=0;
int prevbars=0;
int startpar=0;  // áûëî start
int cs=0;
int prevcs=0;
string commodt="nonono";
int frame=0;
int bars=0;

//---- buffers
double FastWoodieCCI[];
double SlowWoodieCCI[];
double HistoWoodieCCI[];
//+------------------------------------------------------------------+
//| Custom indicator initialization function                         |
//+------------------------------------------------------------------+
int init()
  {
//---- indicators
   SetIndexStyle(0,DRAW_LINE);
   SetIndexBuffer(0,FastWoodieCCI);
   SetIndexStyle(1,DRAW_LINE,1,3);
   SetIndexBuffer(1,SlowWoodieCCI);
   SetIndexStyle(2,DRAW_HISTOGRAM);
   SetIndexBuffer(2,HistoWoodieCCI);
//----
   return(0);
  }
//+------------------------------------------------------------------+
//| Custor indicator deinitialization function                       |
//+------------------------------------------------------------------+
int deinit()
  {
//---- TODO: add your code here

//----
   return(0);
  }
//+------------------------------------------------------------------+
//| Custom indicator iteration function                              |
//+------------------------------------------------------------------+
int start()
  {
   int    counted_bars=IndicatorCounted();
//---- TODO: add your code here
cs= A_period+B_period+num_bars; //checksum used to see if parameters have been changed
if ((cs==prevcs)&&(commodt==Symbol())&&(frame==(Time[4]-Time[5]))&&((Bars-prevbars)<2)) startpar=Bars-prevbars; else startpar=-1;  //params haven't changed only need to calculate new bar
commodt=Symbol();
frame=Time[4]-Time[5];
prevbars = Bars;
prevcs = cs;
if (startpar==1 | startpar==0)  bar=startpar; else initDone = true;

if (initDone)
   {
   FastWoodieCCI[num_bars-1]=0;
   SlowWoodieCCI[num_bars-1]=0;
   HistoWoodieCCI[num_bars-1]=0;
   //SetIndexValue(num_bars-1, 0);
   //SetIndexValue2(num_bars-1, 0);
   bar=num_bars-2;
   initDone=false;
   }

//SetLoopCount(0);
for (shift = bar;shift>=0;shift--)
   {
   FastWoodieCCI[shift]=iCCI(NULL,0,B_period,PRICE_TYPICAL,shift);
   SlowWoodieCCI[shift]=iCCI(NULL,0,A_period,PRICE_TYPICAL,shift);
   HistoWoodieCCI[shift]=iCCI(NULL,0,A_period,PRICE_TYPICAL,shift);
   //SetIndexValue(shift,iCCIEx(A_period,PRICE_TYPICAL,shift));
   //SetIndexValue2(shift,iCCIEx(B_period,PRICE_TYPICAL,shift));
   }

//----
   return(0);
  }
//+------------------------------------------------------------------+
Comments