Waddah_Attar_OMN
Download script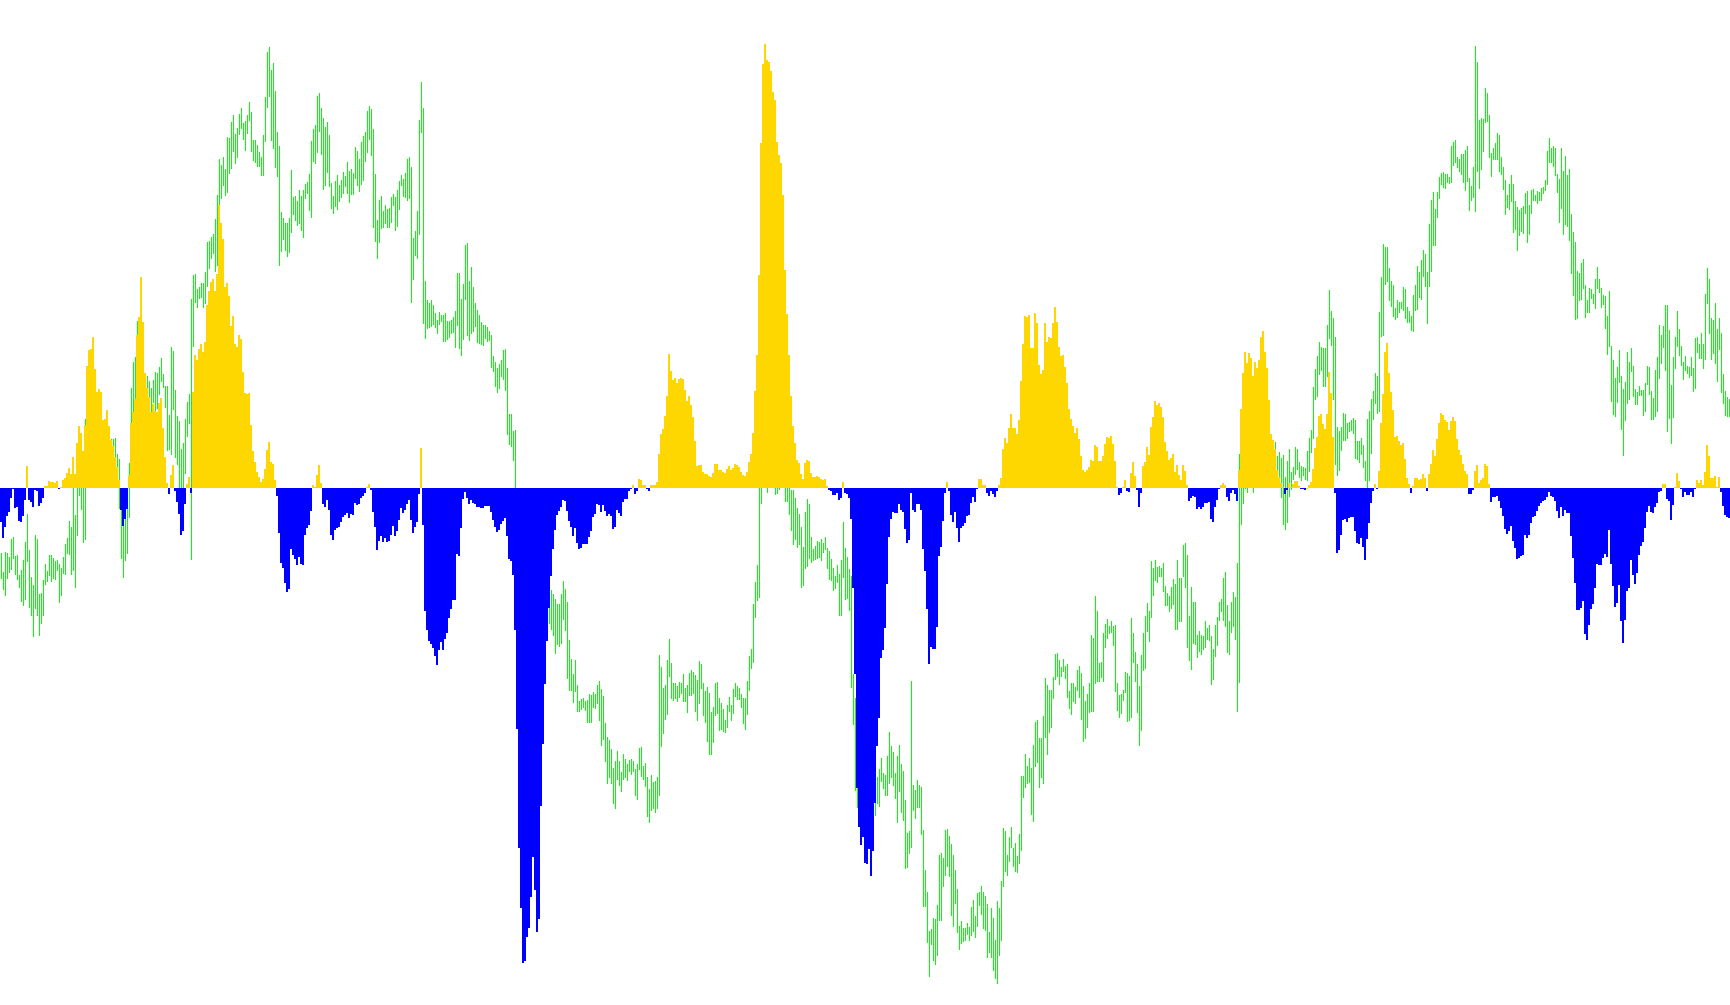
The Waddah Attar OMN indicator is a technical analysis tool designed to help traders visualize market momentum and volatility simultaneously. Instead of looking at standard price charts, this script provides a simplified "health check" of the market's current strength by combining two primary financial behaviors: trend direction and price expansion.
How the Logic Works
The core functionality of the script relies on calculating two distinct pieces of data from the market history:
1. Identifying Momentum (Trend Direction) The logic first looks at the MACD (Moving Average Convergence Divergence). By comparing a fast-moving average against a slower one, the script determines if the price is gaining speed in an upward direction or losing speed in a downward direction. Essentially, it answers the question: "Is the current trend accelerating or slowing down?"
2. Identifying Volatility (Price Expansion) Next, the logic utilizes Bollinger Bands. It measures the distance between the upper and lower boundaries of these bands. This represents the "stretch" of the market. By looking at this expansion, the script identifies how much territory the price is currently covering. It answers the question: "How much energy or 'room' is the market using to move?"
The Combined Output
The script then performs a mathematical multiplication of these two factors—Momentum and Volatility. By multiplying them together, the indicator produces a single value that represents the Total Market Energy.
- Positive Values (Upward Momentum): When the result is positive, the indicator displays a histogram in one color (DeepSkyBlue). This signifies that the market has both bullish momentum and sufficient volatility to support an upward move.
- Negative Values (Downward Momentum): When the result is negative, the indicator displays a histogram in another color (Brown). This indicates that the market is moving with bearish momentum combined with significant downward expansion.
Visual Summary for Traders
Rather than forcing you to read multiple complex lines on a chart, this logic consolidates everything into a single histogram window.
- Tall bars indicate high-intensity movement where both trend and volatility are strongly aligned.
- Short bars suggest a period of consolidation or "choppiness," where the market lacks the necessary energy to make a significant move in either direction.
By monitoring these results, users can more easily identify periods of high-conviction trends versus periods of low-activity noise.
//+------------------------------------------------------------------+
//|                                             Waddah_Attar_OMN.mq4 |
//|                      Copyright © 2008, MetaQuotes Software Corp. |
//|                                        http://www.metaquotes.net |
//+------------------------------------------------------------------+
#property copyright "Copyright © 2008, MetaQuotes Software Corp."
#property link      "http://www.metaquotes.net"

//----
#property  indicator_separate_window
#property  indicator_buffers 2
#property  indicator_color1  DeepSkyBlue
#property  indicator_color2  Brown
#property  indicator_level1  2.5
#property  indicator_level2  -2.5

//----
extern int FastEMA   =60;
extern int SlowEMA   =120;
extern int SMA       =9;
//----
double   ind_buffer1[];
double   ind_buffer2[];
//+------------------------------------------------------------------+
//|                                                                  |
//+------------------------------------------------------------------+
int init()
  {
   SetIndexStyle(0, DRAW_HISTOGRAM, STYLE_SOLID, 2);
   SetIndexStyle(1, DRAW_HISTOGRAM, STYLE_SOLID, 2);
//----
   SetIndexBuffer(0, ind_buffer1);
   SetIndexBuffer(1, ind_buffer2);
//----
   IndicatorShortName("Waddah_Attar_OMN");
   //Comment("copyright waddahwttar@hotmail.com");
   return(0);
  }
//+------------------------------------------------------------------+
//|                                                                  |
//+------------------------------------------------------------------+
int deinit()
  {
   Comment("");
//----
   return(0);
  }
//+------------------------------------------------------------------+
//|                                                                  |
//+------------------------------------------------------------------+
int start()
  {
   double Trend,Explo,val;
   int    limit, i, counted_bars = IndicatorCounted();
//----
   if(counted_bars < 0)
       return(-1);
//----
   if(counted_bars > 0)
       counted_bars--;
   limit = Bars - counted_bars;
//----
   for(i = limit - 1; i >= 0; i--)
     {
       Trend = (iMACD(NULL, 0, FastEMA, SlowEMA, SMA, PRICE_MEDIAN, MODE_MAIN, i) -
                iMACD(NULL, 0, FastEMA, SlowEMA, SMA, PRICE_MEDIAN, MODE_MAIN, i + 1)) / Point;
       Explo = (iBands(NULL, 0, 20, 2, 0, PRICE_MEDIAN, MODE_UPPER, i) -
                iBands(NULL, 0, 20, 2, 0, PRICE_MEDIAN, MODE_LOWER, i)) / Point;
       ind_buffer1[i] = 0;
       ind_buffer2[i] = 0;
       val=Trend*Explo;
       if(val >= 0)
           ind_buffer1[i] = val;
       if(val < 0)
           ind_buffer2[i] = val;
     }
   return(0);
  }
//+------------------------------------------------------------------+
Comments