Three_Color_ma_strict
Download script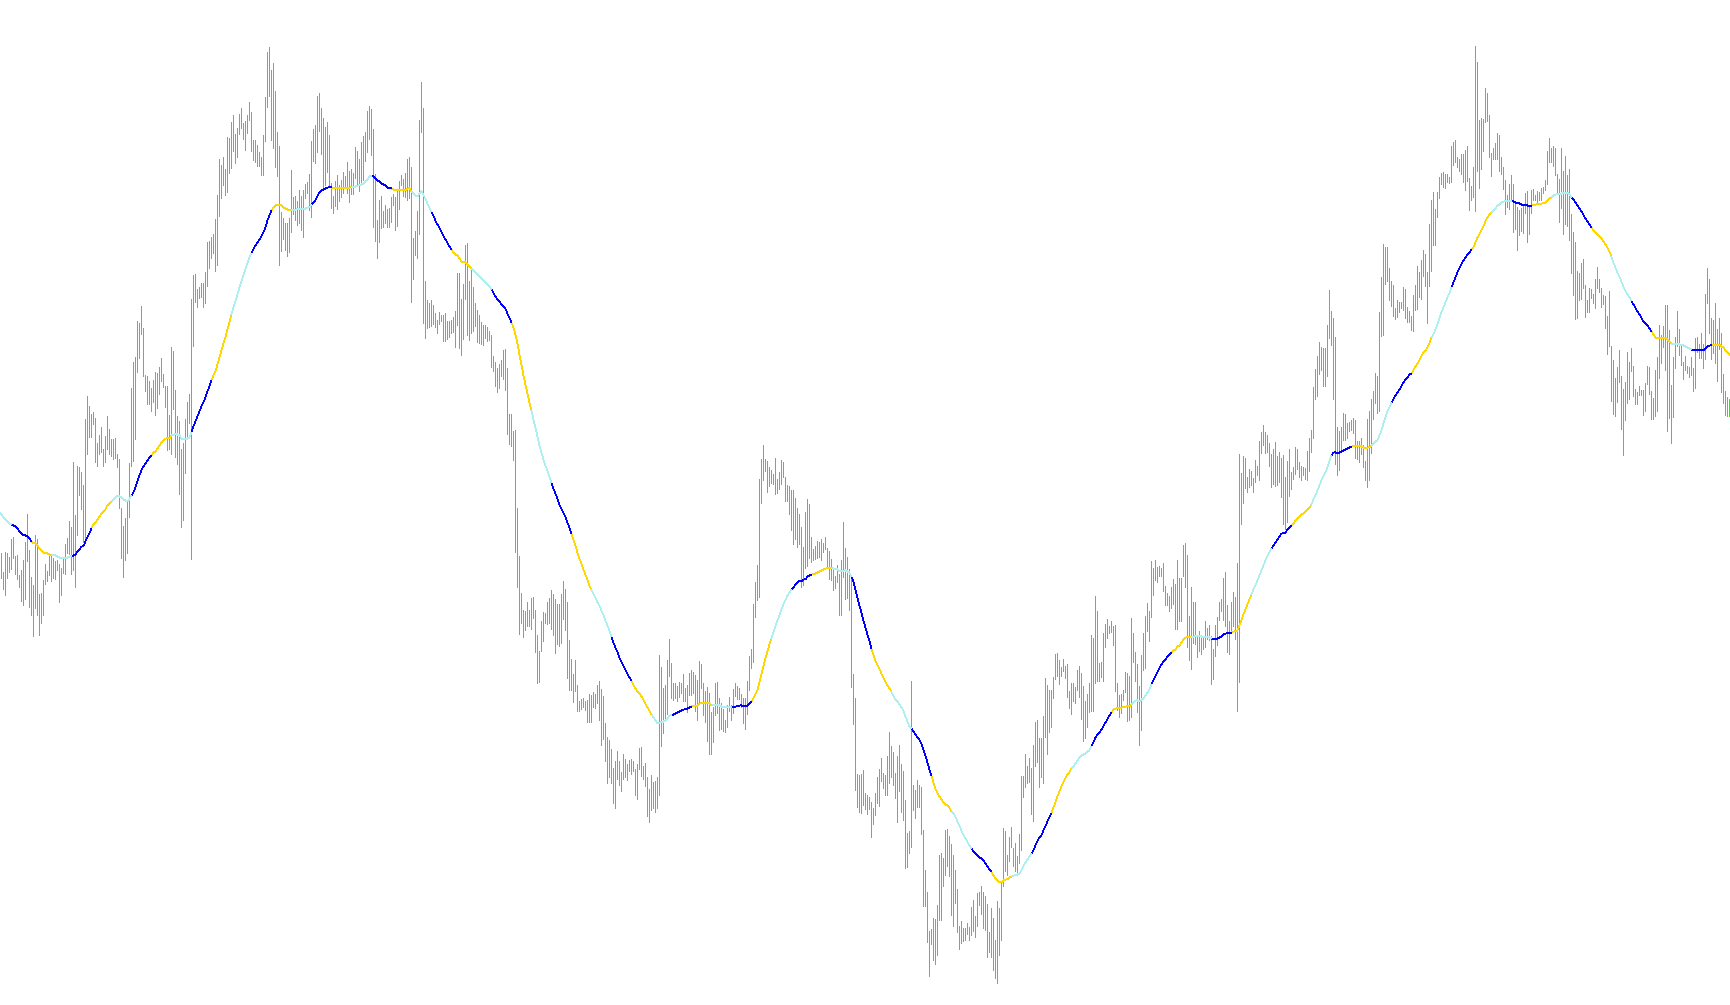
This tool is designed as a visual aid for traders using the MetaTrader platform to identify and visualize specific trends in price action. Instead of showing a single, continuous moving average line, it segments the market data into distinct color-coded phases.
How the Logic Works
The script works by processing historical price data and calculating a moving average based on parameters you choose (such as the time window and the type of mathematical smoothing). Rather than displaying this average constantly, the logic applies a "cycling" behavior to the visual output:
- Sequential Color Cycling: The tool organizes the chart into sections. It rotates through three distinct colors—Red, Green, and Blue—to represent different segments of price history.
- Segmented Visibility: The logic is programmed to show one color at a time for a specific duration (based on a set number of bars). While one color is visible, the others are hidden.
- Automatic Transition: As the script moves forward in time, it automatically switches which color is active. This creates a rhythmic, alternating visual pattern on your chart.
Purpose for the User
By breaking the market data into these recurring three-color segments, the tool helps you visually distinguish between different phases of price movement. It removes the clutter of a single continuous line and replaces it with a structured, multi-colored sequence, making it easier to observe how trends shift over specific intervals of time.
//+------------------------------------------------------------------+
//|                                                  three_color.mq4 |
//|                      Copyright © 2005, MetaQuotes Software Corp. |
//|                                       http://www.metaquotes.net/ |
//+------------------------------------------------------------------+
#property copyright "Copyright © 2005, MetaQuotes Software Corp."
#property link      "http://www.metaquotes.net/"

#property indicator_chart_window
#property indicator_buffers 3
#property indicator_color1 Red
#property indicator_color2 Green
#property indicator_color3 Blue
extern int MAPeriod = 50;
extern int PeriodMode =  1; //0=sma, 1=ema, 2=smma, 3=lwma
//---- buffers
double ExtMapBuffer1[];
double ExtMapBuffer2[];
double ExtMapBuffer3[];
//+------------------------------------------------------------------+
//| Custom indicator initialization function                         |
//+------------------------------------------------------------------+
int init()
  {
   SetIndexStyle(0,DRAW_LINE,STYLE_SOLID,2);
   SetIndexStyle(1,DRAW_LINE,STYLE_SOLID,2);
   SetIndexStyle(2,DRAW_LINE,STYLE_SOLID,2);
   SetIndexBuffer(0,ExtMapBuffer1);
   SetIndexBuffer(1,ExtMapBuffer2);
   SetIndexBuffer(2,ExtMapBuffer3);
//----
   return(0);
  }
//+------------------------------------------------------------------+
//| Custom indicator iteration function                              |
//+------------------------------------------------------------------+
int start()
  {
   int i,j,shift;
   static int width=1;
//----
   for(i=0; i<Bars-21; i+=30)
     {
      for(j=0,shift=i; j<11; j++,shift++)
        {
         ExtMapBuffer1[shift]=iMA(NULL,0,MAPeriod,0,PeriodMode,PRICE_CLOSE,shift);
         if(j>0 && j<10)
           {
            ExtMapBuffer2[shift]=EMPTY_VALUE;
            ExtMapBuffer3[shift]=EMPTY_VALUE;
           }
        }
     }
//----
   for(i=10; i<Bars-11; i+=30)
     {
      for(j=0,shift=i; j<11; j++,shift++)
        {
         ExtMapBuffer2[shift]=iMA(NULL,0,MAPeriod,0,PeriodMode,PRICE_CLOSE,shift);
         if(j>0 && j<10)
           {
            ExtMapBuffer1[shift]=EMPTY_VALUE;
            ExtMapBuffer3[shift]=EMPTY_VALUE;
           }
        }
     }
//----
   for(i=20; i<Bars-1; i+=30)
     {
      for(j=0,shift=i; j<11; j++,shift++)
        {
         ExtMapBuffer3[shift]=iMA(NULL,0,MAPeriod,0,PeriodMode,PRICE_CLOSE,shift);
         if(j>0 && j<10)
           {
            ExtMapBuffer1[shift]=EMPTY_VALUE;
            ExtMapBuffer2[shift]=EMPTY_VALUE;
           }
        }
     }

//----
   return(0);
  }
//+------------------------------------------------------------------+
Comments