Ticker Trail
Download script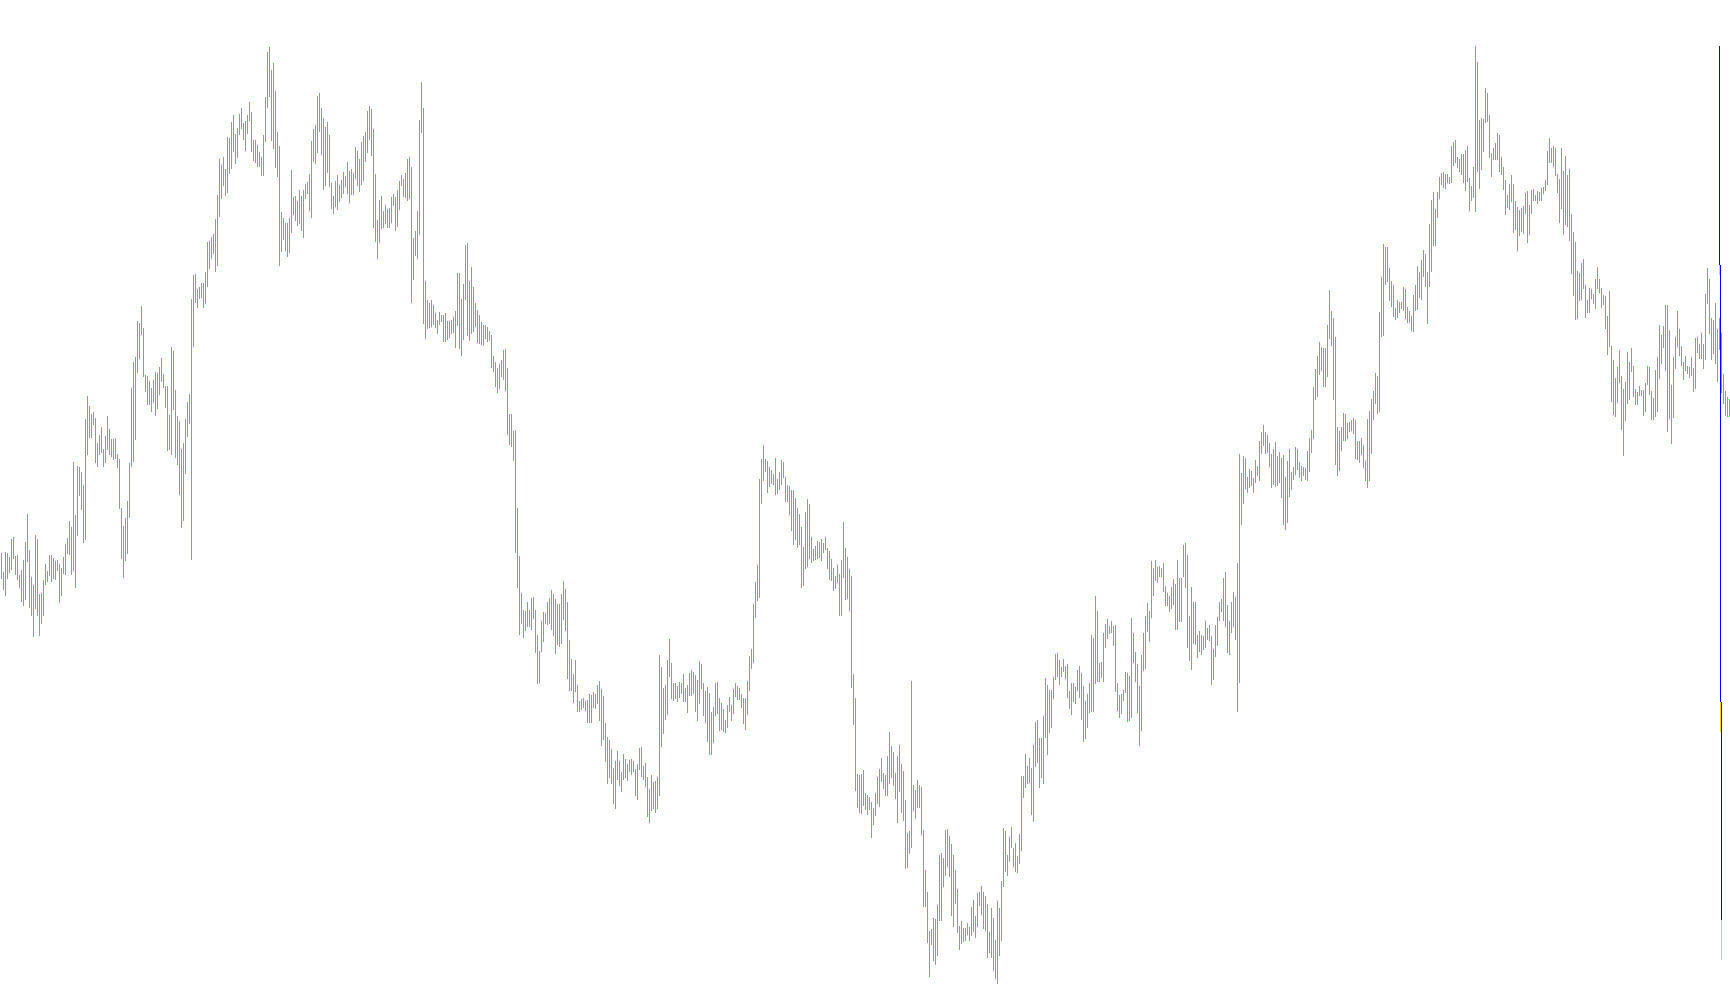
This tool is designed to provide a visual representation of price movement by tracking the history of "ticks"—the smallest price fluctuations—rather than just looking at standard candles. It creates a secondary window on your trading platform that highlights how much the price has deviated from its recent historical path based on a specific sensitivity level.
Core Functionality
The script functions by capturing every price change and storing it in a dedicated memory sequence. Instead of showing you where the price is at any given moment, it builds a history of where the price has been. By looking back at a set number of past movements (adjustable by the user), the tool creates a visual "trail" that follows the price action.
How the Logic Works
- Price Tracking: The script monitors the current market price. Every time the price moves, the tool records that new price and shifts the previous history forward to make room for it. This creates a continuous stream of data points in a linear sequence.
- The Trail Mechanism: The core logic uses a "buffer" or a "safety margin." For every historical price point recorded, the script calculates a value that stays within a specific distance (the "Trail") from the actual price at that time.
- Smoothing and Boundaries: As the tool moves backward through the history to draw the lines:
- It checks if the historical price has strayed too far from the "trail" limit.
- If the price is higher than the allowed trail, it "pulls" the visual line back toward the limit.
- If the price is lower than the allowed trail, it "pushes" the visual line back up.
- Visual Output: The result is a two-line display. One line represents the raw movement of the price ticks, while the second line represents the "Trail." This allows traders to see the relationship between actual market volatility and a smoothed, constrained path based on your chosen sensitivity settings.
User Customization
The logic allows for two main adjustments:
- Trail: This defines how much "slack" or distance the trail is allowed to have. Increasing this value makes the trail follow the price more loosely, while decreasing it makes the trail tighter and more reactive to small price changes.
- CountBars: This determines the depth of the history. It dictates how many past price movements are displayed on your screen at one time, allowing you to see a longer or shorter chronological "tail" of the market's recent behavior.
// Ticker Trail.mq4
// Èíäèêàòîð

#property copyright "mandorr@gmail.com"
#property indicator_separate_window
#property indicator_buffers 2
#property indicator_color1 Yellow
#property indicator_width1 2
#property indicator_style1 0

#property indicator_color2 Gray
#property indicator_width2 2
#property indicator_style2 0

extern int Trail=10;         // Òðàë
extern int CountBars=1000;   // Êîëè÷åñòâî îòîáðàæàåìûõ áàðîâ

int count;
int price;
int price_prev;
int trail;

double ticker[10];           // áóôåð òèêîâ
double buffer0[];
double buffer1[];

void init()
   {
   SetIndexBuffer(0,buffer0);
   SetIndexLabel(0,"Value");
   SetIndexDrawBegin(0,0);

   SetIndexBuffer(1,buffer1);
   SetIndexLabel(1,"Trail");
   SetIndexDrawBegin(1,0);

   count=ArrayResize(ticker,CountBars);
   count=0;
   price_prev=0;
   trail=0; if (Trail>0) trail=Trail;
   }

void start()
   {
   int i, value;
   price=MathRound(Bid/Point);
   if (price_prev==0)
      {
      count=0;
      price_prev=price;
      ticker[0]=price*Point;
      buffer0[0]=ticker[0];
      buffer1[0]=ticker[0];
      IndicatorShortName("Ticker ("+count+") Trail ("+trail+")");
      return;
      }
   if (price==price_prev) return;
   price_prev=price;
   for (i=count; i>=0; i--)
      {
      ticker[i+1]=ticker[i];
      }
   ticker[0]=price*Point;
   if (count<CountBars-1) count++;
   value=MathRound(ticker[count]/Point);
   for (i=count; i>=0; i--)
      {
      buffer0[i]=ticker[i];
      price=MathRound(ticker[i]/Point);
      if (value<price-trail) value=price-trail;
      if (value>price+trail) value=price+trail;
      buffer1[i]=value*Point;
      }
   IndicatorShortName("Ticker ("+count+") Trail ("+trail+")");
   }
Comments