Ticks-2
Download script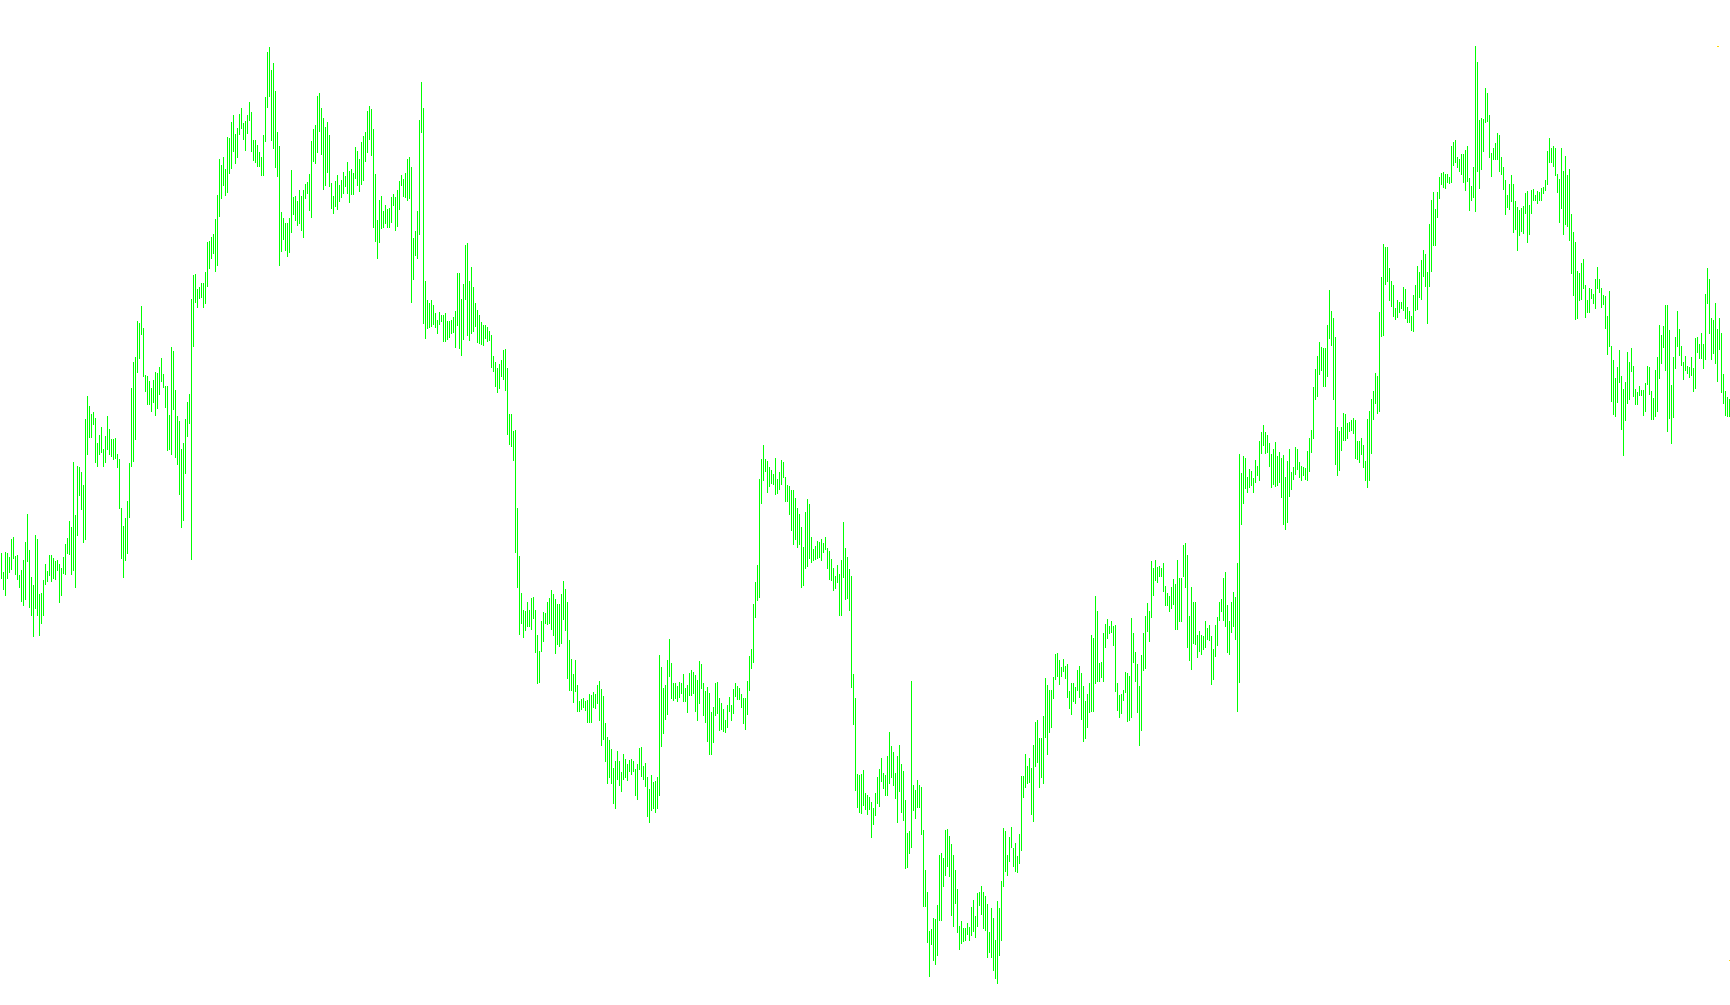
This script is designed to provide a real-time visual representation of price movements on your trading platform. Instead of relying solely on standard candlesticks or bars, it focuses on capturing and displaying individual "ticks"—the smallest and most frequent updates in market price.
Here is a breakdown of how the logic functions:
Real-Time Price Tracking
The core purpose of this tool is to track the current "Bid" price (the price at which you can sell) as it fluctuates second by second. It captures these live movements and plots them on a dedicated sub-window, allowing you to see the immediate flow of the market rather than waiting for a candle to close.
Dynamic Data Management
To ensure your trading platform remains fast and responsive, the script includes an automated cleanup system. Because price data updates so frequently, it could quickly overwhelm the screen. The logic manages this by:
- Limiting Scope: It only keeps a specific amount of recent price history visible (based on a user-defined limit).
- Automatic Shifting: As new price information arrives, the script "pushes" the older data forward and clears out the oldest entries.
- Performance Optimization: By constantly managing which pieces of data are displayed, it prevents the platform from slowing down over time.
Visual Markers and Organization
The script also includes a systematic way to organize visual data on your screen:
- Vertical Delimiters: The logic identifies when a new bar or significant time interval begins and automatically places a dashed vertical line. This helps you visually separate different periods of trading activity.
- Smart Positioning: These vertical lines are designed to move in sync with the price action, ensuring that your visual markers stay aligned with the correct timeframe as new data flows in.
- Horizontal Price Reference: The script automatically identifies or creates a horizontal reference line that follows the current Bid price. This provides a constant visual "anchor" of where the market is currently trading.
Summary for the User
In short, this tool acts like a high-speed recorder for your chart. It captures every tiny movement in the market, organizes those movements into a readable timeline using vertical markers, and ensures that only the most relevant, recent data is shown to keep your workspace clean and efficient.
//+------------------------------------------------------------------+
//|                                                        Ticks.mq4 |
//|                                                       MetaQuotes |
//|                    http://www.alpari-idc.ru/ru/experts/articles/ |
//+------------------------------------------------------------------+
#property copyright "Rosh"
#property link      "http://www.alpari-idc.ru/ru/experts/articles/"

#property indicator_separate_window
#property indicator_buffers 1
#property indicator_color1 Navy
//---- buffers
extern int MaxDrawTicks=500;
double ExtMapBuffer1[];
int myBars;
int tickCounter;
int delimeterCounter;
//+------------------------------------------------------------------+
//| Custom indicator initialization function                         |
//+------------------------------------------------------------------+
int init()
  {
//---- indicators
   SetIndexStyle(0,DRAW_LINE);
   SetIndexBuffer(0, ExtMapBuffer1);
   SetIndexEmptyValue(0,0.0);
   Print("Îáíóëÿåì òèêè");
   for (int i=Bars-1;i>=0;i--) ExtMapBuffer1[i]=0.0;

//----
   return(0);
  }
//+------------------------------------------------------------------+
//| Custom indicator deinitialization function                       |
//+------------------------------------------------------------------+
int deinit()
  {
//----

//----
   return(0);
  }
//+------------------------------------------------------------------+
//| ñäâèíåì ìàññèâ                                                   |
//+------------------------------------------------------------------+
void SetDelimeter()
  {
//----
   string delimeterDate=TimeToStr(Time[0]);
   if (myBars!=0)
      {
      Print("Ñòàâèì ðàçäåëèòåëü");
      int handle=WindowFind("Ticks-2");
      if(!ObjectCreate(delimeterDate,OBJ_VLINE,handle,Time[0],0))
         {
         Alert("Íåäà÷íàÿ ïîïûòêà ñîçäàíèÿ ðàçäåëèòåëÿ â îêíå ",
         handle," ïî âðåìåíè ",TimeToStr(CurTime()));
         Print("Îøèáêà ¹",GetLastError(),", èìÿ ðàçäåëèòåëÿ ",delimeterDate);
         }
      else
         {
         ObjectSet(delimeterDate,OBJPROP_COLOR,DarkGreen);
         ObjectSet(delimeterDate,OBJPROP_STYLE,STYLE_DASHDOT);
         ObjectsRedraw();
         }
      }
//----
   return(0);
  }
//+------------------------------------------------------------------+
//| ñäâèíåì ìàññèâ                                                   |
//+------------------------------------------------------------------+
void ShiftArray()
  {
//----
   int V_lines;
   string delimeterName;
   datetime firstTime;
   int BarFirstTime;

   if (tickCounter>2*MaxDrawTicks)
      {
      for (int i=tickCounter;i>=MaxDrawTicks;i--) ExtMapBuffer1[i]=0.0;
      tickCounter=MaxDrawTicks;
      }
   for(int cnt=tickCounter;cnt>0;cnt--)
      {
      ExtMapBuffer1[cnt]=ExtMapBuffer1[cnt-1];
      }
   V_lines=ObjectsTotal();
   for (int z=0;z<V_lines;z++)
      {
      delimeterName=ObjectName(z);
      if (ObjectFind(delimeterName)!=-1)
         {
         if (ObjectType(delimeterName)==OBJ_VLINE)
            {
            firstTime=ObjectGet(delimeterName,OBJPROP_TIME1);
            BarFirstTime=iBarShift(NULL,0,firstTime);
            if (BarFirstTime>MaxDrawTicks) ObjectDelete(delimeterName);// ðàçäåëèòåëü óøåë äàëüøå
            else                                                       // ÷åì  MaxDrawTicks
               {  // åñëè óäàëÿòü íå íóæíî - äâèãàåì
               firstTime=Time[BarFirstTime+1];
               ObjectSet(delimeterName,OBJPROP_TIME1,firstTime);
               }
            }
         }
      }
//----
   return(0);
  }
//+------------------------------------------------------------------+
//| ïðèçíàê íîâîãî áàðà                                              |
//+------------------------------------------------------------------+
bool isNewBar()
  {
//----
   bool res=false;
   if (myBars!=Bars)
      {
      res=true;
      myBars=Bars;
      }
//----
   return(res);
  }
//+------------------------------------------------------------------+
//| Custom indicator iteration function                              |
//+------------------------------------------------------------------+
int start()
  {
   int    counted_bars=IndicatorCounted();
//----
   if (isNewBar())
      {
      // óñòàíîâèòü ðàçäåëèòåëü
      tickCounter++;
      SetDelimeter();
      ExtMapBuffer1[0]=Bid;
      }
   else

      {
      tickCounter++;
      ShiftArray();
      ExtMapBuffer1[0]=Bid;
         int handleTicks=WindowFind("Ticks-2");// èùåì îêíî èíäèêàòîðà
   if (handleTicks!=-1)
      {
      if (ObjectFind("bidLINE")!=-1) // íàøëè ãîðèçîíòàëüíóþ ëèíèþ ñ èìåíåì bidLINE
         {
         if (ObjectType("bidLINE")==OBJ_HLINE) ObjectSet("bidLINE",OBJPROP_PRICE1,Bid);
         }
      else //íå íàøëè ãîðèçîíòàëüíóþ ëèíèþ ñ èìåíåì bidLINE , ñîçäàäèì e¸
         {
         if(!ObjectCreate("bidLINE",OBJ_HLINE,handleTicks,0,Bid))
            {
            Alert("Íåäà÷íàÿ ïîïûòêà ñîçäàíèÿ ëèíèè Bid â îêíå ",
            handleTicks," ïî öåíå ",Bid);
            Print("Îøèáêà ¹",GetLastError());
            }
         else
            {
            ObjectSet("bidLINE",OBJPROP_COLOR,Gray);
            ObjectSet("bidLINE",OBJPROP_STYLE,STYLE_SOLID);
            ObjectsRedraw();
            }
         }
      }

      }
//----
   return(0);
  }
//+------------------------------------------------------------------+
Comments