Three_Color_ma
Download script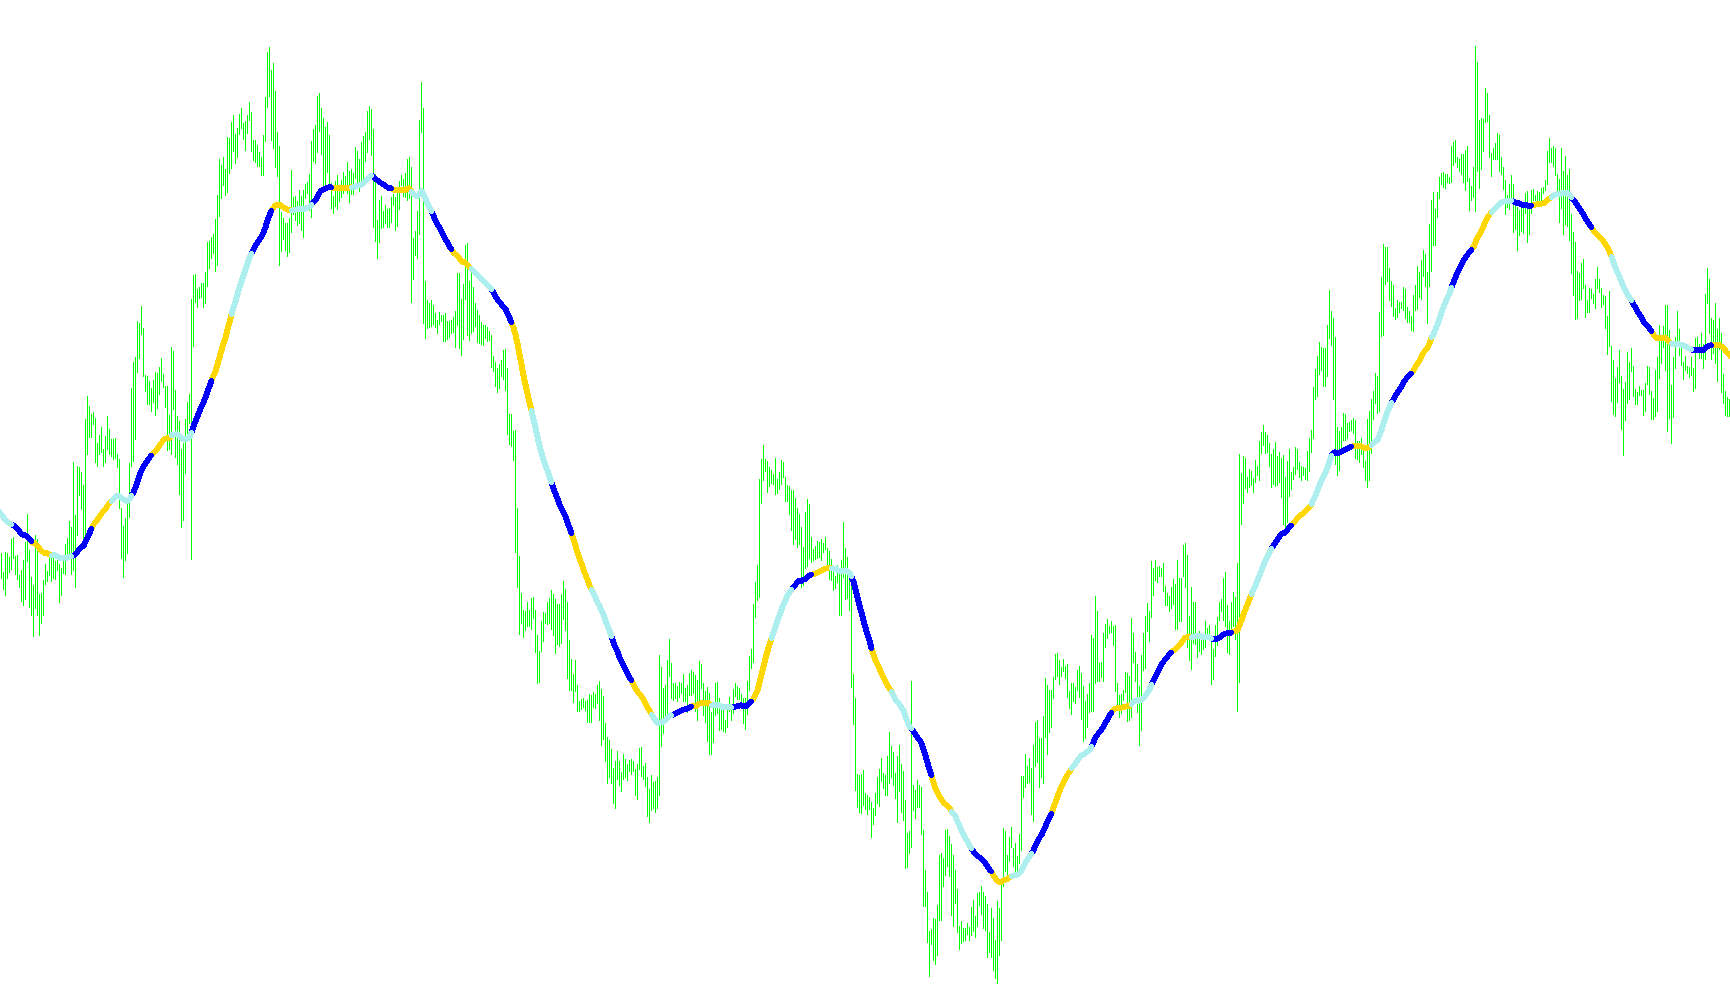
This custom indicator is designed to visualize moving averages on a trading chart using a distinct three-color coding system. Instead of showing a single continuous line, the tool segments data into three separate visual components (Red, Green, and Blue), allowing for a more structured view of price trends over time.
Core Functionality
The script calculates a moving average based on a user-defined period and type (such as Simple, Exponential, Smoothed, or Linear Weighted). However, rather than plotting this value constantly, the logic divides the chart history into repeating three-part cycles.
How the Logic Works
The tool operates by looping through your price history and applying the moving average calculation to specific windows of time. It distinguishes between three different states:
- Primary Segment (Red): The script identifies the first section of a cycle and highlights it in Red. In this phase, the red indicator is active while the others are hidden.
- Secondary Segment (Green): Following the first section, the logic shifts to the next segment, activating the Green indicator. During this period, the previous colors are suppressed to maintain clarity.
- Tertiary Segment (Blue): The final section of the cycle activates the Blue indicator, completing the three-part rotation.
Key Visual Characteristics
- Cyclical Pattern: The logic repeats these three segments consistently across the chart. This creates a rhythmic visual flow where each color represents a specific chronological "block" of the moving average trend.
- Clean Display: By specifically instructing the software to leave the other two colors "empty" whenever one is active, the script ensures that the lines do not overlap or clutter the screen. You only see one colored line at any given time.
- Dynamic Line Weight: The indicator features a unique property where the thickness of the lines increases gradually as it processes data, creating a visual progression on the chart.
Summary for the User
This tool is essentially a "segmented" moving average. It takes a standard trend indicator and breaks it into three distinct color-coded phases. It is designed for traders who prefer to see the movement of the market divided into regular intervals, making it easier to track historical cycles and visual patterns across different timeframes.
//+------------------------------------------------------------------+
//|                                                  three_color.mq4 |
//|                      Copyright © 2005, MetaQuotes Software Corp. |
//|                                       http://www.metaquotes.net/ |
//+------------------------------------------------------------------+
#property copyright "Copyright © 2005, MetaQuotes Software Corp."
#property link      "http://www.metaquotes.net/"

#property indicator_chart_window
#property indicator_buffers 3
#property indicator_color1 Red
#property indicator_color2 Green
#property indicator_color3 Blue
extern int MAPeriod = 50;
extern int PeriodMode =  1; //0=sma, 1=ema, 2=smma, 3=lwma
//---- buffers
double ExtMapBuffer1[];
double ExtMapBuffer2[];
double ExtMapBuffer3[];
//+------------------------------------------------------------------+
//| Custom indicator initialization function                         |
//+------------------------------------------------------------------+
int init()
  {
   SetIndexBuffer(0,ExtMapBuffer1);
   SetIndexBuffer(1,ExtMapBuffer2);
   SetIndexBuffer(2,ExtMapBuffer3);
//----
   return(0);
  }
//+------------------------------------------------------------------+
//| Custom indicator iteration function                              |
//+------------------------------------------------------------------+
int start()
  {
   int i,j,shift;
   static int width=1;
//----
   for(i=0; i<Bars-21; i+=30)
     {
      for(j=0,shift=i; j<11; j++,shift++)
        {
         ExtMapBuffer1[shift]=iMA(NULL,0,MAPeriod,0,PeriodMode,PRICE_CLOSE,shift);
         if(j>0 && j<10)
           {
            ExtMapBuffer2[shift]=EMPTY_VALUE;
            ExtMapBuffer3[shift]=EMPTY_VALUE;
           }
        }
     }
//----
   for(i=10; i<Bars-11; i+=30)
     {
      for(j=0,shift=i; j<11; j++,shift++)
        {
         ExtMapBuffer2[shift]=iMA(NULL,0,MAPeriod,0,PeriodMode,PRICE_CLOSE,shift);
         if(j>0 && j<10)
           {
            ExtMapBuffer1[shift]=EMPTY_VALUE;
            ExtMapBuffer3[shift]=EMPTY_VALUE;
           }
        }
     }
//----
   for(i=20; i<Bars-1; i+=30)
     {
      for(j=0,shift=i; j<11; j++,shift++)
        {
         ExtMapBuffer3[shift]=iMA(NULL,0,MAPeriod,0,PeriodMode,PRICE_CLOSE,shift);
         if(j>0 && j<10)
           {
            ExtMapBuffer1[shift]=EMPTY_VALUE;
            ExtMapBuffer2[shift]=EMPTY_VALUE;
           }
        }
     }
//----
   if(width>10) width=1;
   else width++;
   SetIndexStyle(0,DRAW_LINE,STYLE_SOLID,width);
   SetIndexStyle(1,DRAW_LINE,STYLE_SOLID,width);
   SetIndexStyle(2,DRAW_LINE,STYLE_SOLID,width);
//----
   return(0);
  }
//+------------------------------------------------------------------+
Comments