Ticker Bars
Download script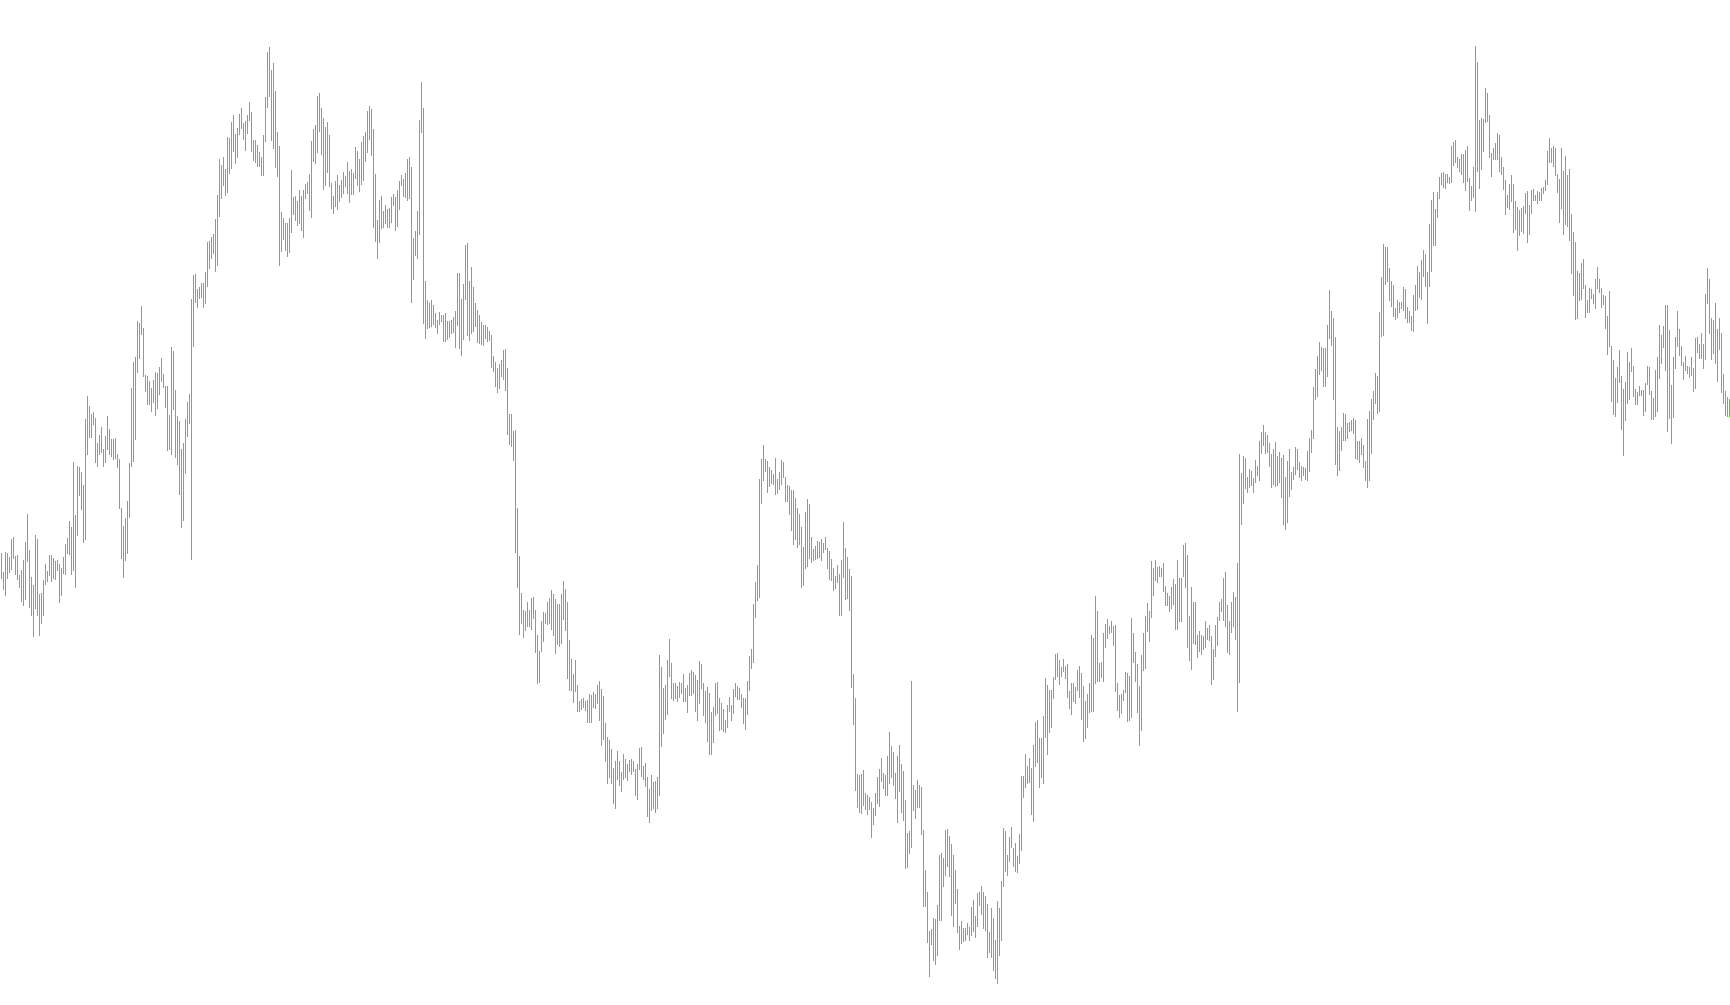
This tool is designed to provide a unique visual representation of price movement by creating custom "Ticker Bars" in a separate window on your trading platform. Unlike standard candles or line charts that follow strict time intervals (like 1-minute or 1-hour bars), this script generates bars based on price activity, allowing you to visualize market behavior more dynamically.
How the Logic Works
1. Price Movement Detection The script constantly monitors the current market price. It ignores minor fluctuations and only triggers an update when the price moves by a significant enough amount to round to the next whole unit. This ensures that the data plotted is meaningful and not cluttered by "noise."
2. Dynamic Bar Construction Instead of waiting for a specific time to pass, the script groups price movements into bars based on a user-defined volume:
- Volume Threshold: You can set how many price "ticks" (movements) should occur before a new bar is finalized.
- Data Tracking: As price moves, the script captures the highest and lowest points reached during that period, as well as the starting and ending prices.
3. Visual Representation Once a bar's volume limit is reached, the script draws two distinct elements for every historical movement:
- High/Low Range: It marks the total vertical distance traveled by the price during that specific movement set.
- Open/Close Body: It draws a thicker line representing the "body" of the move, connecting where the price started to where it ended.
- Color Coding: The script automatically detects the direction of the move; if the price ended lower than it started, the bar is colored Red. If it ended higher, it is colored Blue.
4. Real-Time Updates The tool includes a live "Bid" tracker—a silver horizontal line that follows the current market price in real-time. This allows you to see exactly where the current price sits in relation to the historical Ticker Bars generated by the script.
Key Features for the User
- Customizable Bar Size: You can adjust the width of the lines and the total number of bars displayed to suit your screen layout.
- Historical Context: By capturing the "High" and "Low" of every movement, you get a clearer picture of market volatility than a standard line chart could provide.
- Independent Window: Because it opens in its own window, it won't interfere with your main price chart, providing a clean secondary analysis of price flow.
// Ticker Bars.mq4
// Èíäèêàòîð

#property copyright "mandorr@gmail.com"
#property indicator_separate_window
#property indicator_buffers 2

extern int BarVolume=15;    // Òèêîâûé îáúåì áàðà
extern int BarWidth=5;      // Øèðèíà ëèíèè áàðà
extern int BarsCount=1000;  // Êîëè÷åñòâî îòîáðàæàåìûõ áàðîâ

int    win_index;
int    price_prev;
int    tickers;
int    bar_tick;
int    bar_size;
int    bar_open [];
int    bar_high [];
int    bar_low  [];
int    bar_close[];
double buffer0  [];
double buffer1  [];

void init() {
   SetIndexBuffer(0,buffer0);
   SetIndexBuffer(1,buffer1);
   SetIndexStyle (0,DRAW_NONE);
   SetIndexStyle (1,DRAW_NONE);
   SetIndexEmptyValue(0,0.0);
   SetIndexEmptyValue(1,0.0);
   SetIndexLabel (0,"High");
   SetIndexLabel (1,"Low");
   SetIndexDrawBegin(0,0);
   SetIndexDrawBegin(1,0);
   IndicatorDigits(Digits);

   for (int i=0; i<=BarsCount; i++) {
      buffer0[i]=0.0;
      buffer1[i]=0.0;
   }

   price_prev=0;
   tickers=0;
   bar_tick=0;
   bar_size=0;
}

void deinit() {
   ObjectsDeleteAll(win_index);
}

void start() {
   int i, price;
   string bar_name, line_name, win_name;
   double open, high, low, close; datetime time;

   price=MathRound(Bid/Point);
   if (price==0) {return;}
   if (price==price_prev) {return;}
   price_prev=price;
   tickers++;
   bar_tick++;

   win_name="Ticker ("+tickers+") Volume ("+BarVolume+")";
   IndicatorShortName(win_name);
   win_index=WindowFind(win_name);

   if (bar_size==0) {
      bar_size=1;
      ArrayResize(bar_open ,1);
      ArrayResize(bar_high ,1);
      ArrayResize(bar_low  ,1);
      ArrayResize(bar_close,1);
      bar_open [0]=price;
      bar_high [0]=price;
      bar_low  [0]=price;
      bar_close[0]=price;
   }

   if (bar_tick>BarVolume) {
      bar_tick=1;
      bar_size++;
      if (bar_size>BarsCount) {bar_size=BarsCount;}
      else {
         ArrayResize(bar_open ,bar_size);
         ArrayResize(bar_high ,bar_size);
         ArrayResize(bar_low  ,bar_size);
         ArrayResize(bar_close,bar_size);
      }
      for (i=bar_size-1; i>0; i--) {
         bar_open [i]=bar_open [i-1];
         bar_high [i]=bar_high [i-1];
         bar_low  [i]=bar_low  [i-1];
         bar_close[i]=bar_close[i-1];
      }
      bar_open [0]=price;
      bar_high [0]=price;
      bar_low  [0]=price;
      bar_close[0]=price;
   }
   if (bar_high[0]<price) {bar_high[0]=price;}
   if (bar_low [0]>price) {bar_low [0]=price;}
   bar_close[0]=price;

   for (i=0; i<bar_size; i++) {
      open =bar_open [i]*Point;
      high =bar_high [i]*Point;
      low  =bar_low  [i]*Point;
      close=bar_close[i]*Point;
      time =Time[i];

      color bar_color;
      if (close<open) {bar_color=Red;} else {bar_color=Blue;}

      bar_name="Win"+win_index+"_Bar"+i+"_HL";
      if (ObjectFind(bar_name)!=win_index) {
         ObjectCreate(bar_name,OBJ_TREND,win_index,time,high,time,low);
      }
      ObjectSet(bar_name,OBJPROP_TIME1,time);
      ObjectSet(bar_name,OBJPROP_TIME2,time);
      ObjectSet(bar_name,OBJPROP_PRICE1,high);
      ObjectSet(bar_name,OBJPROP_PRICE2,low);
      ObjectSet(bar_name,OBJPROP_STYLE,DRAW_LINE);
      ObjectSet(bar_name,OBJPROP_WIDTH,1);
      ObjectSet(bar_name,OBJPROP_RAY,false);
      ObjectSet(bar_name,OBJPROP_COLOR,bar_color);

      bar_name="Win"+win_index+"_Bar"+i+"_OC";
      if (ObjectFind(bar_name)!=win_index) {
         ObjectCreate(bar_name,OBJ_TREND,win_index,time,open,time,close);
      }
      ObjectSet(bar_name,OBJPROP_TIME1,time);
      ObjectSet(bar_name,OBJPROP_TIME2,time);
      ObjectSet(bar_name,OBJPROP_PRICE1,open);
      ObjectSet(bar_name,OBJPROP_PRICE2,close);
      ObjectSet(bar_name,OBJPROP_STYLE,DRAW_LINE);
      ObjectSet(bar_name,OBJPROP_WIDTH,BarWidth);
      ObjectSet(bar_name,OBJPROP_RAY,false);
      ObjectSet(bar_name,OBJPROP_COLOR,bar_color);

      buffer0[i]=high;
      buffer1[i]=low ;
   }
   buffer0[bar_size]=0.0;
   buffer1[bar_size]=0.0;

   line_name="Win"+win_index+"_Bid";
   if (ObjectFind(line_name)!=win_index) {
      ObjectCreate(line_name,OBJ_HLINE,win_index,time,Bid);
   }
   ObjectSet(line_name,OBJPROP_PRICE1,Bid);
   ObjectSet(line_name,OBJPROP_STYLE,DRAW_LINE);
   ObjectSet(line_name,OBJPROP_WIDTH,1);
   ObjectSet(line_name,OBJPROP_COLOR,Silver);
}

// End
Comments