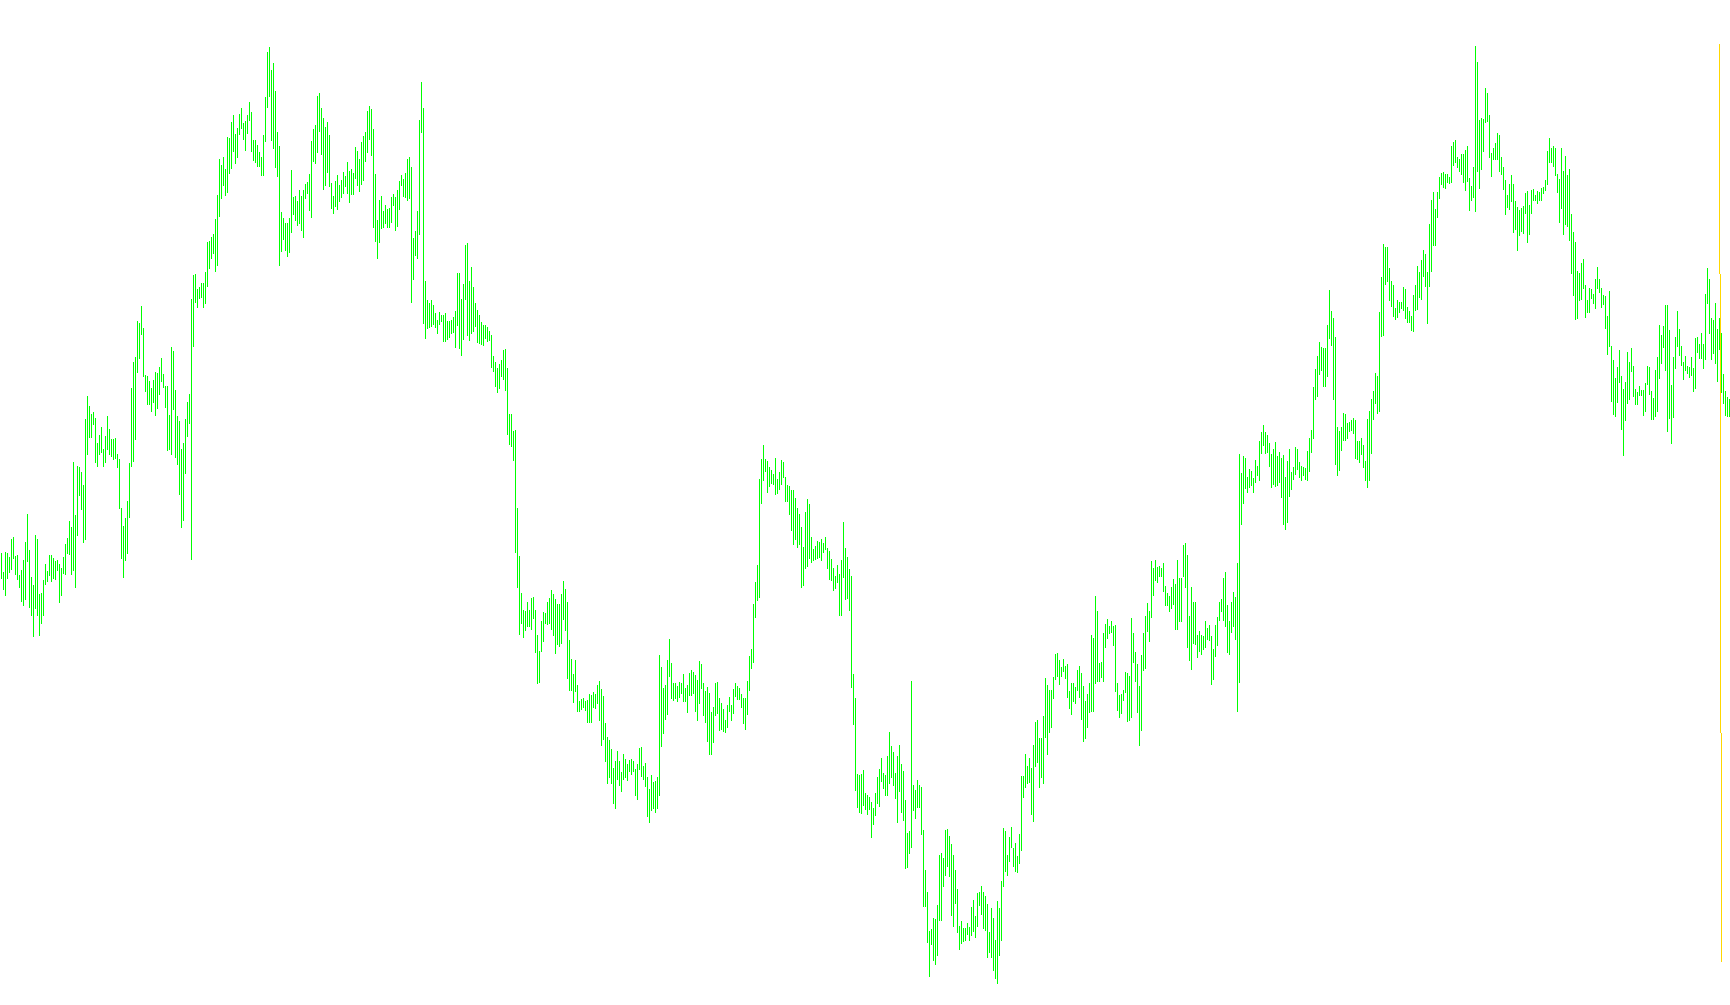
This indicator is designed to provide a visual representation of price momentum and volatility by tracking how current market prices relate to specific historical "trailing" boundaries. Instead of simply showing the raw price movement, it creates a relative measurement that helps traders visualize the strength of a trend based on two distinct sensitivity levels.
Core Logic and Mechanism
The script operates by maintaining a rolling history of the latest price points. It uses two different "trail" parameters—a fast trail and a slow trail—to establish boundaries around these prices:
- Fast Trail: This reacts more quickly to recent price fluctuations. It acts as a short-term boundary that moves in closer proximity to the current market action.
- Slow Trail: This is less sensitive and follows the broader price movement over a longer duration, acting as a primary baseline for the overall trend.
How the Calculation Works
As each new price tick occurs, the script looks back through the recorded history (up to a user-defined limit of bars). For every point in that history, it compares the price to the fast and slow trail limits:
- Dynamic Tracking: The tool constantly updates the "fast" and "slow" values. If a historical price exceeds the designated trail distance, the indicator adjusts those values to follow that price movement.
- Relative Positioning: The primary goal of the logic is to calculate the gap between these two trails. By measuring the distance between the fast-moving boundary and the slow-moving boundary, the script determines the "intensity" of the current market cycle.
- Normalization: To make this data readable on a standard chart window, the indicator converts this gap into a percentage-based value. It scales the difference between the two trails against the total range between your chosen settings.
Visual Interpretation
The resulting output is displayed in a separate window below your main price chart. Rather than showing erratic price spikes, it provides a smoothed line that represents the relative strength of the trend.
- When the line moves higher, it indicates that the fast price action is pulling away from the slower historical baseline at a significant rate.
- When the line moves lower, it suggests the momentum is cooling off or reversing.
In short, this tool serves as a "momentum speedometer," allowing you to see how aggressively the current market is moving relative to its recent history, filtered through two different levels of sensitivity.
// Ticker TrailCD.mq4
// Èíäèêàòîð

#property copyright "mandorr@gmail.com"
#property indicator_separate_window
#property indicator_buffers 1

#property indicator_color1 MediumVioletRed
#property indicator_width1 2
#property indicator_style1 0
#property indicator_maximum  120
#property indicator_minimum -120

extern int TrailFast=25;     // Áûñòðûé òðàë
extern int TrailSlow=65;     // Ìåäëåííûé òðàë
extern int CountBars=1000;   // Êîëè÷åñòâî îòîáðàæàåìûõ áàðîâ

int count;
int price;
int price_prev;

int trail_fast;
int trail_slow;

double ticker[10];           // áóôåð òèêîâ
double buffer[];

void init()
   {
   SetIndexBuffer(0,buffer);
   SetIndexLabel(0,"Value");
   SetIndexDrawBegin(0,0);

   count=ArrayResize(ticker,CountBars);
   count=0;
   price_prev=0;

   trail_fast=0; if (TrailFast>0) trail_fast=TrailFast;
   trail_slow=0; if (TrailSlow>0) trail_slow=TrailSlow;
   }

void start()
   {
   int i, value_fast, value_slow;
   if (trail_fast>=trail_slow) {Print("Íåâåðíûå ïàðàìåòðû èíäèêàòîðà"); return;}
   price=MathRound(Bid/Point);
   if (price_prev==0)
      {
      count=0;
      price_prev=price;
      ticker[0]=price*Point;
      buffer[0]=0;
      IndicatorShortName("Ticker ("+count+") TrailCD ("+trail_fast+","+trail_slow+")");
      return;
      }
   if (price==price_prev) return;
   price_prev=price;
   for (i=count; i>=0; i--)
      {
      ticker[i+1]=ticker[i];
      }
   ticker[0]=price*Point;
   if (count<CountBars-1) count++;
   price=MathRound(ticker[count]/Point);
   value_fast=price;
   value_slow=price;
   for (i=count; i>=0; i--)
      {
      price=MathRound(ticker[i]/Point);
      if (value_fast<price-trail_fast) value_fast=price-trail_fast;
      if (value_fast>price+trail_fast) value_fast=price+trail_fast;
      if (value_slow<price-trail_slow) value_slow=price-trail_slow;
      if (value_slow>price+trail_slow) value_slow=price+trail_slow;
      buffer[i]=100*(value_fast-value_slow)/(trail_slow-trail_fast);
      }
   IndicatorShortName("Ticker ("+count+") TrailCD ("+trail_fast+","+trail_slow+")");
   }
Comments