SuperSR8
Download script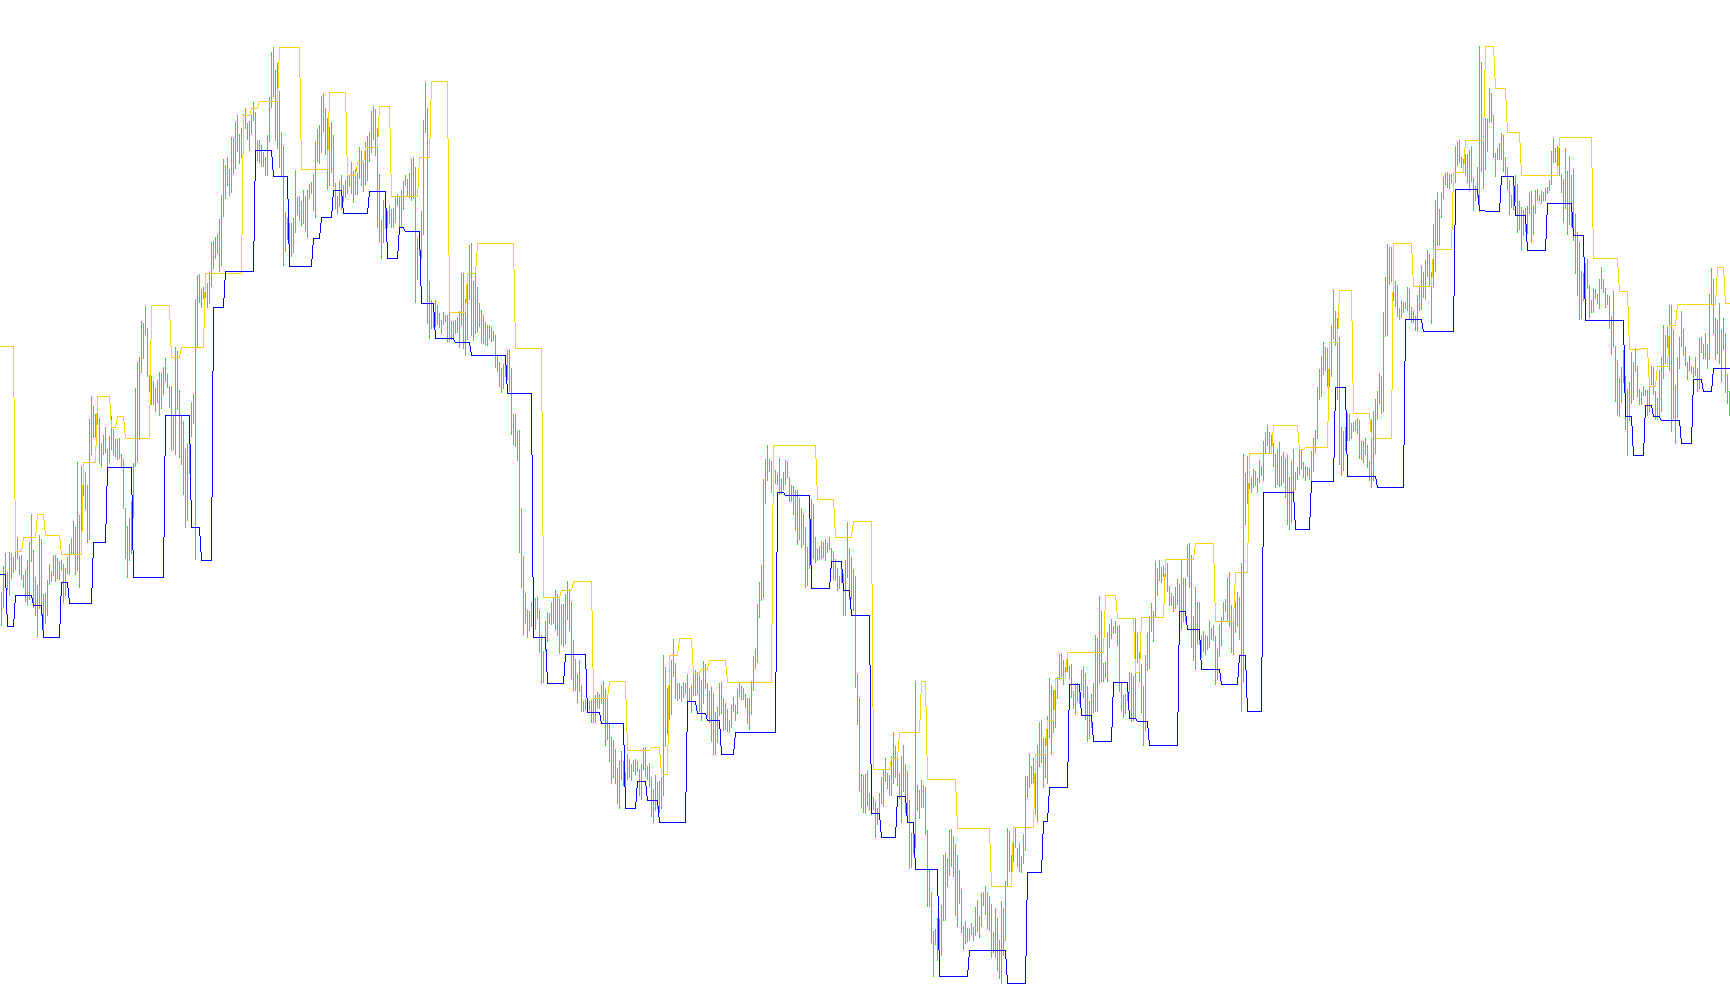
This tool is designed to automatically identify and track key price levels—specifically Support and Resistance—on a trading chart. It works by scanning historical price movements to find significant "peaks" and "valleys," allowing traders to visualize where the market might struggle to move higher or lower.
How the Logic Works
1. Identifying Market Structure (Fractals) The script constantly monitors the recent history of the market to find specific formations known as fractals.
- A Resistance point is identified when a high price peak is significantly higher than the candles immediately surrounding it.
- A Support point is identified when a low price valley is significantly lower than the candles immediately surrounding it.
2. Dynamic Level Mapping Rather than drawing a line at every single peak or valley, the script uses a "gap" logic. It checks how far away the current market price is from the previous known level:
- If the new peak or valley found is too close to the existing one (based on a user-defined distance), the script ignores it to avoid cluttering the chart.
- If the new point is sufficiently far away, the script "snaps" to that new price and draws a horizontal line. This ensures that only major, significant structural shifts are highlighted rather than minor fluctuations.
3. Visual Representation The tool projects these levels onto your chart as continuous lines:
- Resistance Levels: Represented as upper boundaries where price has historically faced selling pressure.
- Support Levels: Represented as lower boundaries where price has historically found buying interest.
4. Automated Alerts Beyond just drawing lines, the script acts as a monitoring system. It watches the current live price against these identified levels:
- Buy Alert: If the current price moves above a Resistance level during specific time windows, the system triggers an alert.
- Sell Alert: If the current price drops below a Support level during those same windows, it triggers a corresponding alert.
Summary for the User
Essentially, this script automates the "manual" work of a trader by scanning thousands of candles to find the most important floor and ceiling prices. It filters out the noise to show you only the significant levels that matter, providing real-time notifications when the price breaks through these critical boundaries.
//+------------------------------------------------------------------+
//|                SuperSR 8.mq4                                     |
//|                Copyright © 2006  Scorpion@fxfisherman.com        |
//+------------------------------------------------------------------+

#property indicator_chart_window
#property indicator_buffers 2
#property indicator_color1 Red
#property indicator_color2 Blue

extern int Contract_Step=50;
extern int Precision=1;
extern int Shift_Bars=1;
extern int Bars_Count= 1000;
int buy = 0, sell = 0;
//---- buffers
double v1[];
double v2[];

int init()
  {

   IndicatorBuffers(2);

   //SetIndexArrow(0, 159);
   SetIndexStyle(0,DRAW_LINE,STYLE_SOLID,1);
   SetIndexDrawBegin(0,-1);
   SetIndexBuffer(0, v1);
   SetIndexLabel(0,"Resistance");

   //SetIndexArrow(1, 159);
   SetIndexStyle(1,DRAW_LINE,STYLE_SOLID,1);
   SetIndexDrawBegin(1,-1);
   SetIndexBuffer(1, v2);
   SetIndexLabel(1,"Support");

   return(0);
  }

int start()
 {
 int m;
    m = Time[0] + Period()*60 - CurTime();
    m = (m - m % 60) / 60;
  double gap;
  double contract = (Contract_Step + Precision) * Point;
  int i;
  int shift;
  bool fractal;
  double price;

  i = Bars_Count;

  while(i>=0)
   {
    shift = i + Shift_Bars;

    // Resistance
    price = High[shift+2];
    fractal = price >= High[shift+4] &&
              price >= High[shift+3] &&
              price > High[shift+1] &&
              price > High[shift];

    gap = v1[i+1] - price;
    if (fractal && (gap >= contract || gap < 0))
    {
      v1[i] = price + (Precision * Point);
    }else{
      v1[i] = v1[i+1];
    }

    // Support
    price = Low[shift+2];
    fractal = price <= Low[shift+4] &&
              price <= Low[shift+3] &&
              price < Low[shift+1] &&
              price < Low[shift];

    gap = price - v2[i+1];
    if (fractal && (gap >= contract || gap < 0))
    {
      v2[i] = price - (Precision * Point);
    }else{
      v2[i] = v2[i+1];
    }

    i--;
   }

   if(buy == 0 && iLow(NULL,0,0) > v1[0] && m < 2){
   Alert("Buy " + Symbol());
   buy = 1;
   sell = 0;
   }
      if(sell == 0 && iHigh(NULL,0,0) < v2[0] && m < 2){
   Alert("Sell " + Symbol());
   buy = 0;
   sell = 1;
   }

  return(0);
 }

//+------------------------------------------------------------------+
Comments