SuperTrend_004
Download script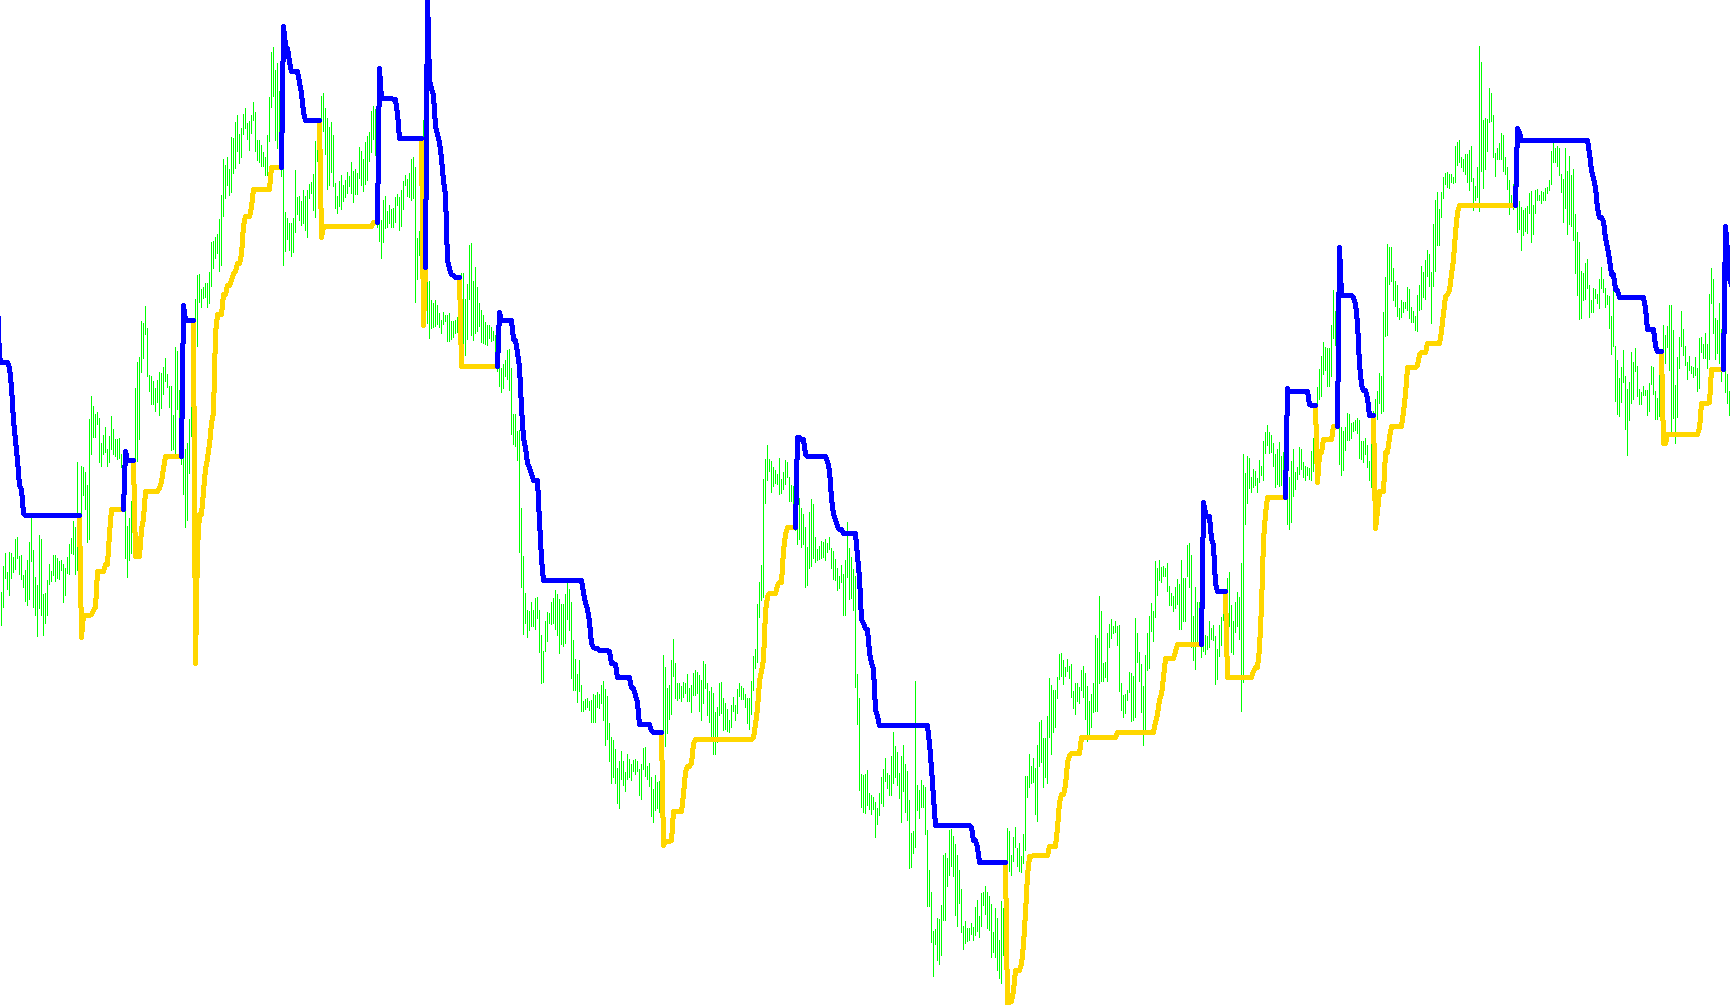
The SuperTrend indicator is designed to provide a visual representation of market momentum by identifying the prevailing direction of price movement. It functions by establishing a dynamic boundary around the current price, acting as a guide to help traders distinguish between "uptrends" and "downtrends" in real-time.
Core Operational Logic
The logic behind this tool operates through three primary stages:
1. Volatility and Price Positioning To determine where the trend lines should sit, the script calculates a "Median Price" for every candle (the midpoint between the highest and lowest price). It then incorporates a volatility measurement known as the Average True Range (ATR). By combining these two elements—the price location and the recent market volatility—the indicator creates an upper and lower boundary.
2. Trend Identification and Switching The script constantly monitors whether the current closing price is breaking above or below these calculated boundaries:
- Bullish Movement: If the price closes significantly above the upper boundary, the script recognizes a positive trend.
- Bearish Movement: If the price closes significantly below the lower boundary, the script recognizes a negative trend.
- Continuity: If the price remains within the established boundaries without a significant breakout, the indicator maintains its current trend direction.
3. Dynamic Adjustment and Smoothing A key feature of this logic is how it handles "trailing" movements. Rather than allowing the trend line to jump erratically with every minor price wiggle, the script applies a rule of protection:
- In an Uptrend, the lower boundary (the "support") will only move upward; it will never drop, ensuring that as price moves higher, the floor stays firm.
- In a Downtrend, the upper boundary (the "resistance") will only move downward; it will never rise, ensuring that as price falls, the ceiling follows.
Visual Execution
For the user, this logic translates into two distinct lines on the chart:
- Trend Up: Represented by a specific color (Lime), this line follows the price from below, signaling a bullish environment.
- Trend Down: Represented by a different color (Red), this line follows the price from above, signaling a bearish environment.
When the trend flips—for example, when a price breaks through a resistance level to initiate an uptrend—the indicator switches colors and positions itself on the opposite side of the price action, providing a clear visual signal for potential trade entries or trend shifts.
//+------------------------------------------------------------------+
//|                                              SuperTrend.mq4 v1.2 |
//|                   Copyright © 2008, Jason Robinson (jnrtrading). |
//|                                   http://www.spreadtrade2win.com |
//+------------------------------------------------------------------+
#property copyright "Copyright © 2008, Jason Robinson."
#property link      "http://www.spreadtrade2win.com"

#property indicator_chart_window
#property indicator_color1 Lime
#property indicator_color2 Red
#property indicator_width1 2
#property indicator_width2 2
#property indicator_buffers 2
double TrendUp[], TrendDown[];
int changeOfTrend;
extern int Nbr_Periods = 10;
extern double Multiplier = 3.0;
//+------------------------------------------------------------------+
//| Custom indicator initialization function                         |
//+------------------------------------------------------------------+
int init()
  {
//---- indicators
   SetIndexBuffer(0, TrendUp);
   SetIndexStyle(0, DRAW_LINE, STYLE_SOLID, 5);
   SetIndexLabel(0, "Trend Up");
   SetIndexBuffer(1, TrendDown);
   SetIndexStyle(1, DRAW_LINE, STYLE_SOLID, 5);
   SetIndexLabel(1, "Trend Down");
//----
   return(0);
  }
//+------------------------------------------------------------------+
//| Custom indicator deinitialization function                       |
//+------------------------------------------------------------------+
int deinit()
  {
//----

//----
   return(0);
  }
//+------------------------------------------------------------------+
//| Custom indicator iteration function                              |
//+------------------------------------------------------------------+
int start()
  {
   int limit, i, flag, flagh, trend[5000];
   double up[5000], dn[5000], medianPrice, atr;
   int counted_bars = IndicatorCounted();
//---- check for possible errors
   if(counted_bars < 0) return(-1);
//---- last counted bar will be recounted
   if(counted_bars > 0) counted_bars--;
   limit=Bars-counted_bars;
   //Print(limit);

//----
   for (i = Bars; i >= 0; i--) {
      TrendUp[i] = EMPTY_VALUE;
      TrendDown[i] = EMPTY_VALUE;
      atr = iATR(NULL, 0, Nbr_Periods, i);
      //Print("atr: "+atr[i]);
      medianPrice = (High[i]+Low[i])/2;
      //Print("medianPrice: "+medianPrice[i]);
      up[i]=medianPrice+(Multiplier*atr);
      //Print("up: "+up[i]);
      dn[i]=medianPrice-(Multiplier*atr);
      //Print("dn: "+dn[i]);
      trend[i]=1;


      if (Close[i]>up[i+1]) {
         trend[i]=1;
         if (trend[i+1] == -1) changeOfTrend = 1;
         //Print("trend: "+trend[i]);

      }
      else if (Close[i]<dn[i+1]) {
         trend[i]=-1;
         if (trend[i+1] == 1) changeOfTrend = 1;
         //Print("trend: "+trend[i]);
      }
      else if (trend[i+1]==1) {
         trend[i]=1;
         changeOfTrend = 0;
      }
      else if (trend[i+1]==-1) {
         trend[i]=-1;
         changeOfTrend = 0;
      }

      if (trend[i]<0 && trend[i+1]>0) {
         flag=1;
         //Print("flag: "+flag);
      }
      else {
         flag=0;
         //Print("flagh: "+flag);
      }

      if (trend[i]>0 && trend[i+1]<0) {
         flagh=1;
         //Print("flagh: "+flagh);
      }
      else {
         flagh=0;
         //Print("flagh: "+flagh);
      }

      if (trend[i]>0 && dn[i]<dn[i+1])
         dn[i]=dn[i+1];

      if (trend[i]<0 && up[i]>up[i+1])
         up[i]=up[i+1];

      if (flag==1)
         up[i]=medianPrice+(Multiplier*atr);

      if (flagh==1)
         dn[i]=medianPrice-(Multiplier*atr);

      //-- Draw the indicator
      if (trend[i]==1) {
         TrendUp[i]=dn[i];
         if (changeOfTrend == 1) {
            TrendUp[i+1] = TrendDown[i+1];
            changeOfTrend = 0;
         }
      }
      else if (trend[i]==-1) {
         TrendDown[i]=up[i];
         if (changeOfTrend == 1) {
            TrendDown[i+1] = TrendUp[i+1];
            changeOfTrend = 0;
         }
      }
   }
   WindowRedraw();

//----
   return(0);
  }
//+------------------------------------------------------------------+
Comments