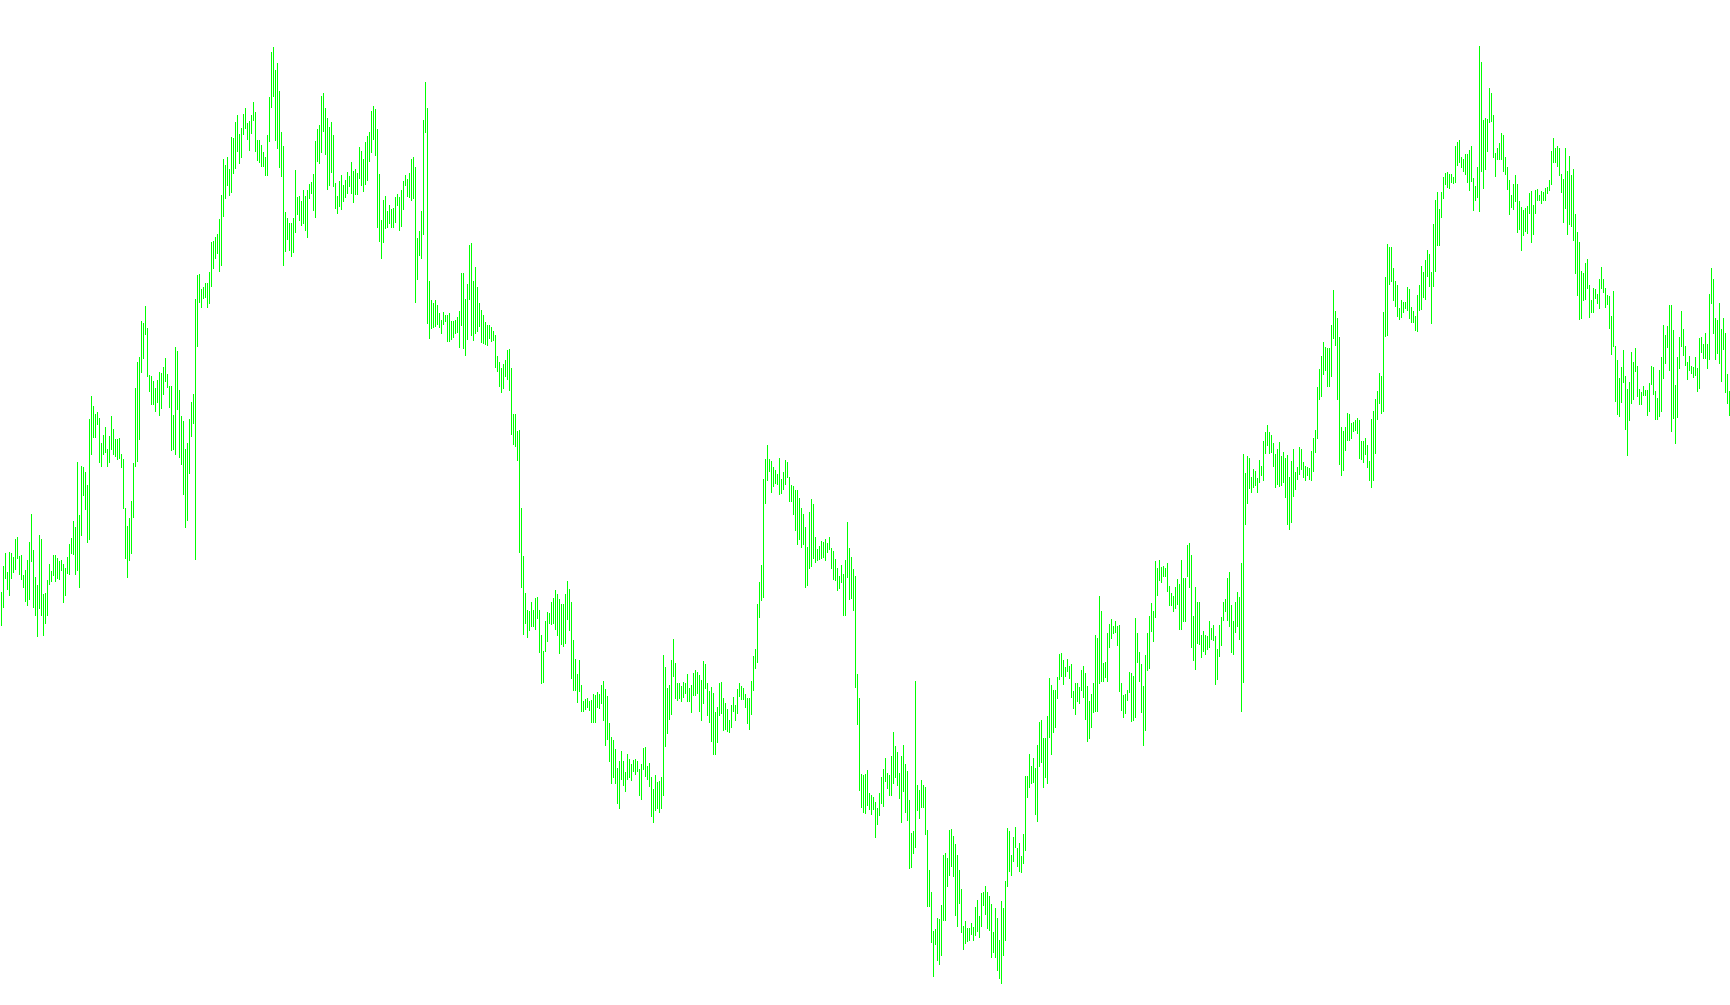
This technical tool is designed to identify and visualize market trends by calculating dynamic price boundaries. Instead of relying on static levels, it uses a combination of volatility measurements and price action to create a visual "buffer" that helps traders distinguish between upward and downward momentum.
Core Logic and Mechanics
Volatility-Based Boundary Calculation The logic begins by measuring the market's current volatility using a standard technical calculation (ATR). By combining this volatility data with the midpoint of the current price candle, the script establishes two mathematical boundaries: an upper boundary and a lower boundary. The distance between these boundaries is controlled by a user-defined multiplier, allowing the tool to expand or contract based on how much the market is moving.
Trend Identification The script continuously monitors whether the closing price of a candle breaks through these calculated boundaries:
- Uptrend: If the price closes above the previous upper boundary, the script identifies a bullish trend.
- Downtrend: If the price closes below the previous lower boundary, the script identifies a bearish trend.
Trend Persistence and Smoothing To prevent "noise" from creating too many false signals, the script includes logic to maintain the current trend unless a significant break occurs. It specifically looks for instances where the price fails to break the boundaries; in these cases, the script holds the existing trend line in place. This creates a smoother visual experience by preventing the trend lines from jittering during minor price fluctuations.
Dynamic Adjustments and Transitions One of the sophisticated features of this logic is how it handles "Trend Changes." When a definitive flip from an uptrend to a downtrend (or vice versa) occurs, the script resets its coordinates to ensure a clean visual transition. Additionally, it includes specific logic to ensure that as a trend progresses, the boundary lines do not move in a direction that contradicts the established momentum, providing a more stable "ceiling" or "floor" for the price action.
Visual Output
The final result is a visual aid on your chart that displays:
- Trend Lines: Solid lines that act as dynamic supports and resistances based on volatility.
- Histogram Elements: High and low markers that help define the range of each bar relative to the current trend.
By using these calculations, the tool provides a clear distinction between periods of active trending and periods of consolidation, helping users see where the "path of least resistance" currently lies in the market.
//+------------------------------------------------------------------+
#property copyright "Copyright © 2008, Jason Robinson."
#property link      "http://www.spreadtrade2win.com"
//MODIFIED BY KALENZO - contact@fxservice.eu
#property indicator_chart_window
#property indicator_color1 Lime
#property indicator_color2 Red
#property indicator_color3 Blue
#property indicator_color4 Red
#property indicator_width1 2
#property indicator_width2 2
#property indicator_width3 4
#property indicator_width4 4
#property indicator_buffers 4
double TrendUp[], TrendDown[];

double BarUp[], BarDown[];

int changeOfTrend;
extern int Nbr_Periods = 10;
extern double Multiplier = 3.0;
//+------------------------------------------------------------------+
//| Custom indicator initialization function                         |
//+------------------------------------------------------------------+
int init()
  {
//---- indicators
   SetIndexBuffer(0, TrendUp);
   SetIndexStyle(0, DRAW_LINE, STYLE_SOLID, 2);
   SetIndexLabel(0, "Trend Up");
   SetIndexBuffer(1, TrendDown);
   SetIndexStyle(1, DRAW_LINE, STYLE_SOLID, 2);
   SetIndexLabel(1, "Trend Down");

   SetIndexBuffer(2, BarUp);
   SetIndexBuffer(3, BarDown);
   SetIndexStyle(2,DRAW_HISTOGRAM,STYLE_SOLID,1);
   SetIndexStyle(3,DRAW_HISTOGRAM,STYLE_SOLID,1);
//----
   return(0);
  }
//+------------------------------------------------------------------+
//| Custom indicator deinitialization function                       |
//+------------------------------------------------------------------+
int deinit()
  {
//----

//----
   return(0);
  }
//+------------------------------------------------------------------+
//| Custom indicator iteration function                              |
//+------------------------------------------------------------------+
int start()
  {
   int limit, i, flag, flagh, trend[50000];
   double up[50000], dn[50000], medianPrice, atr;
   int counted_bars = IndicatorCounted();
//---- check for possible errors
   if(counted_bars < 0) return(-1);
//---- last counted bar will be recounted
   if(counted_bars > 0) counted_bars--;
   limit=Bars-counted_bars;
   //Print(limit);

//----
   for (i = Bars; i >= 0; i--) {
      TrendUp[i] = EMPTY_VALUE;
      TrendDown[i] = EMPTY_VALUE;
      atr = iATR(NULL, 0, Nbr_Periods, i);
      //Print("atr: "+atr[i]);
      medianPrice = (High[i]+Low[i])/2;
      //Print("medianPrice: "+medianPrice[i]);
      up[i]=medianPrice+(Multiplier*atr);
      //Print("up: "+up[i]);
      dn[i]=medianPrice-(Multiplier*atr);
      //Print("dn: "+dn[i]);
      trend[i]=1;


      if (Close[i]>up[i+1]) {
         trend[i]=1;
         if (trend[i+1] == -1) changeOfTrend = 1;
         //Print("trend: "+trend[i]);

      }
      else if (Close[i]<dn[i+1]) {
         trend[i]=-1;
         if (trend[i+1] == 1) changeOfTrend = 1;
         //Print("trend: "+trend[i]);
      }
      else if (trend[i+1]==1) {
         trend[i]=1;
         changeOfTrend = 0;
      }
      else if (trend[i+1]==-1) {
         trend[i]=-1;
         changeOfTrend = 0;
      }

      if (trend[i]<0 && trend[i+1]>0) {
         flag=1;
         //Print("flag: "+flag);
      }
      else {
         flag=0;
         //Print("flagh: "+flag);
      }

      if (trend[i]>0 && trend[i+1]<0) {
         flagh=1;
         //Print("flagh: "+flagh);
      }
      else {
         flagh=0;
         //Print("flagh: "+flagh);
      }

      if (trend[i]>0 && dn[i]<dn[i+1])
         dn[i]=dn[i+1];

      if (trend[i]<0 && up[i]>up[i+1])
         up[i]=up[i+1];

      if (flag==1)
         up[i]=medianPrice+(Multiplier*atr);

      if (flagh==1)
         dn[i]=medianPrice-(Multiplier*atr);

      //-- Draw the indicator
      if (trend[i]==1) {
         TrendUp[i]= dn[i];
         BarUp[i] = High[i];
         BarDown[i] = Low[i];

         if (changeOfTrend == 1) {
            TrendUp[i+1] = TrendDown[i+1];
            changeOfTrend = 0;
         }
      }
      else if (trend[i]==-1) {
         TrendDown[i]=up[i];
         BarUp[i] = Low[i];
         BarDown[i] = High[i];
         if (changeOfTrend == 1) {
            TrendDown[i+1] = TrendUp[i+1];
            changeOfTrend = 0;
         }
      }
   }
   WindowRedraw();

//----
   return(0);
  }
//+------------------------------------------------------------------+
Comments