SuperTrend_3
Download script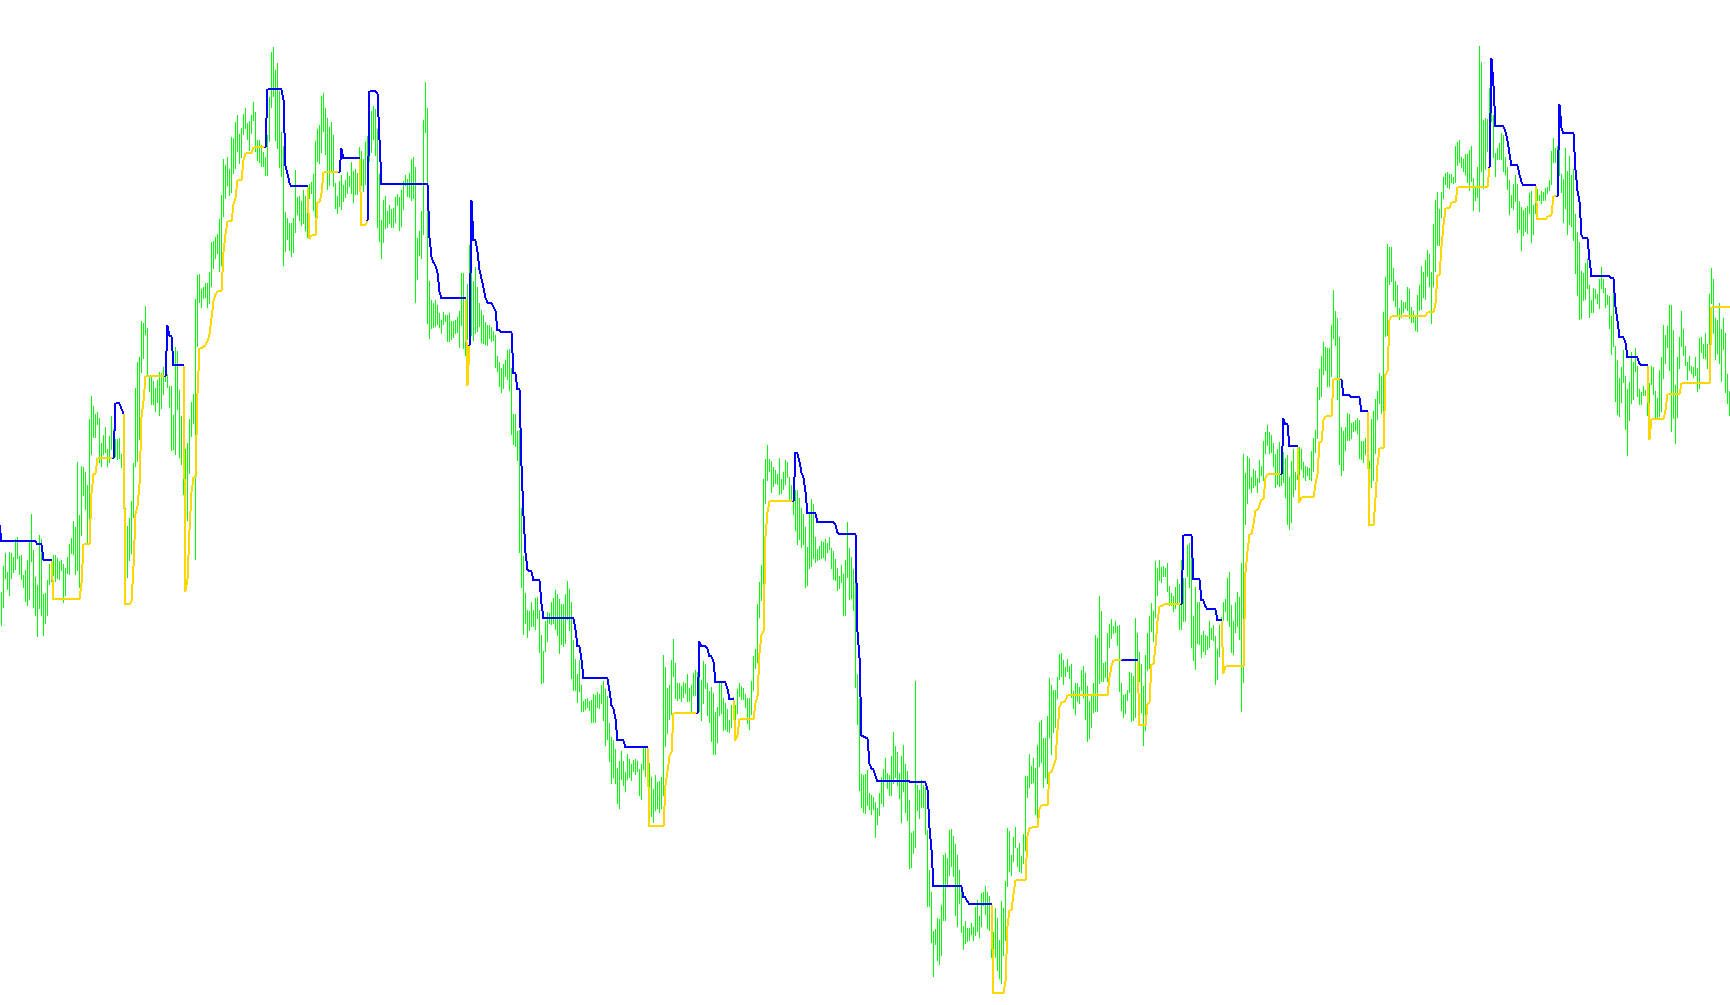
This script is a technical trading tool designed to identify and visualize market trends directly on a price chart. By calculating the momentum of price movements, it helps traders distinguish between "uptrend" and "downtrend" phases, providing a visual guide to help determine whether the market is currently moving upward or downward.
Core Logic and Behavior
The script operates by comparing different averages of price data to determine the overall direction of the market. Here is a breakdown of how it processes information:
1. Trend Detection via Moving Averages The tool looks at two different moving averages. It compares a current average against a slightly older average.
- When the current moving average is higher than the previous one, the script identifies an Upward Trend.
- When the current moving average falls below the previous one, it identifies a Downward Trend.
2. Dynamic Price Buffers (The "SuperTrend" Line) Rather than just showing a simple line, the tool calculates a "buffer" or "zone" based on market volatility (using a calculation known as ATR).
- In an Uptrend: It places a support line below the price. The logic ensures this line never moves downward; if the price drops but stays above the line, the line holds steady. If the price breaks significantly below it, the trend status can flip.
- In a Downtrend: It places a resistance line above the price. Similarly, this line is designed to stay flat or move upward as the price fluctuates, only changing direction when the market momentum shifts.
3. Visual Feedback The script simplifies complex data into two distinct visual elements on your chart:
- A green-colored line typically appears during bullish (upward) movements.
- A crimson-colored line appears during bearish (downward) movements.
User Customization
The tool allows for adjustments to two primary factors:
- Periods: This determines the "sensitivity" of the moving averages. A higher number makes the trend lines smoother and slower to react, while a lower number makes them more reactive to quick price changes.
- Multiplier: This acts as a scaling factor for the periods, allowing you to expand or contract the timeframe used for calculations without changing the base period number manually.
Summary of Purpose
For a visitor looking at this tool, the primary goal is trend confirmation. It filters out "market noise" by creating a trailing line that follows the price. As long as the price remains on one side of the colored line, the trend is considered intact. When the price crosses through the line and the logic flips, the script signals a potential change in market direction.
//+------------------------------------------------------+\\
//|         SuperTrend_3.mq4 Release 20061022-1          |\\
//|  Copyright © 2005-2006, jnrtrading (Jason Robinson)  |\\
//|   Contact @ http://www.spreadtrade2win.com/forum/    |\\
//+------------------------------------------------------+\\
#property copyright "Copyright © 2005, Jason Robinson (jnrtrading)."
#property link      "http://www.jnrtrading.co.uk"

#property indicator_chart_window
#property indicator_buffers 3
#property indicator_color1 MediumSeaGreen
#property indicator_color2 Crimson

double TrendUp[], TrendDown[], MA[];
double MA1, MA2;
bool trendIsUp;

extern int Nb_Periods = 10;
extern double Multiplier = 2;
/*extern bool Automatic_Timeframe_Settings = false;
extern int M1_Nb_Periods = 10;
extern int M5_Nb_Periods = 10;
extern int M15_Nb_Periods = 12;
extern int M30_Nb_Periods = 10;
extern int H1_Nb_Periods = 10;
extern int H4_Nb_Periods = 10;
extern int D1_Nb_Periods = 10;
extern int W1_Nb_Periods = 10;
extern int MN_Nb_Periods = 10;*/
//+------------------------------------------------------------------+
//| Custom indicator initialization function                         |
//+------------------------------------------------------------------+
int init()
  {
//---- indicators

   IndicatorBuffers(3);
   SetIndexBuffer(0, TrendUp);
   SetIndexStyle(0, DRAW_LINE, STYLE_SOLID, 2);
   SetIndexBuffer(1, TrendDown);
   SetIndexStyle(1, DRAW_LINE, STYLE_SOLID, 2);

//----
   return(0);
  }
//+------------------------------------------------------------------+
//| Custor indicator deinitialization function                       |
//+------------------------------------------------------------------+
int deinit()
  {
//----

//----
   return(0);
  }
//+------------------------------------------------------------------+
//| Custom indicator iteration function                              |
//+------------------------------------------------------------------+
int start()
  {
   int limit, i, j, shift;
   //double Price3;
   int counted_bars = IndicatorCounted();
//---- check for possible errors
   if(counted_bars < 0) return(-1);
//---- last counted bar will be recounted
   if(counted_bars > 0) counted_bars--;

   limit=Bars-counted_bars;
   if (Multiplier == 0) Multiplier = 0.1;

   for (i = limit; i >= 0; i--) {
      MA1 = iMA(NULL, 0, Nb_Periods*Multiplier, 0, MODE_SMA, PRICE_TYPICAL, i);
      MA2 = iMA(NULL, 0, Nb_Periods*Multiplier, 0, MODE_SMA, PRICE_TYPICAL, i+Nb_Periods);

      if (MA1 >= MA2) {
         if (TrendDown[i+Nb_Periods+1] != EMPTY_VALUE && TrendUp[i+Nb_Periods+2] != EMPTY_VALUE) {
            TrendDown[i+Nb_Periods+1] = EMPTY_VALUE;
            TrendUp[i+Nb_Periods+1] = TrendUp[i+Nb_Periods+2];
         }
         TrendUp[i+Nb_Periods] = Low[i+Nb_Periods]-iATR(NULL,0,16,i);
         TrendDown[i+Nb_Periods] = EMPTY_VALUE;
         if(TrendDown[i+Nb_Periods+1] != EMPTY_VALUE) TrendUp[i+Nb_Periods+1] = TrendDown[i+Nb_Periods+1];
         if (TrendUp[i+Nb_Periods] < TrendUp[i+Nb_Periods+1] && TrendUp[i+Nb_Periods+1] != TrendDown[i+Nb_Periods+1]) TrendUp[i+Nb_Periods] = TrendUp[i+Nb_Periods+1];
         trendIsUp = true;
      }
      else if (MA1 <= MA2) {
         if (TrendUp[i+Nb_Periods+1] != EMPTY_VALUE && TrendDown[i+Nb_Periods+2] != EMPTY_VALUE) {
            TrendUp[i+Nb_Periods+1] = EMPTY_VALUE;
            TrendDown[i+Nb_Periods+1] = TrendDown[i+Nb_Periods+2];
         }
         TrendDown[i+Nb_Periods] = High[i+Nb_Periods]+iATR(NULL,0,16,i);
         TrendUp[i+Nb_Periods] = EMPTY_VALUE;
         if(TrendUp[i+Nb_Periods+1] != EMPTY_VALUE) TrendDown[i+Nb_Periods+1] = TrendUp[i+Nb_Periods+1];
         if (TrendDown[i+Nb_Periods] > TrendDown[i+Nb_Periods+1] && TrendDown[i+Nb_Periods+1] != TrendUp[i+Nb_Periods+1]) TrendDown[i+Nb_Periods] = TrendDown[i+Nb_Periods+1];
         trendIsUp = false;
      }
   }
   // Fill the gap at the end
   if (trendIsUp == true) {
      //Comment("Trend Is Up");
      for (j = Nb_Periods; j > 0; j--) {
         TrendUp[j] = Low[j]-Point*(Digits*2);
         if (TrendUp[j] < TrendUp[j+1]) {TrendUp[j] = TrendUp[j+1];}
      }
   }
   else {
      //Comment("Trend Is Down");
      for (j = Nb_Periods; j > 0; j--) {
         TrendDown[j] = High[j]+Point*(Digits*2);
         if (TrendDown[j] > TrendDown[j+1]) {TrendDown[j] = TrendDown[j+1];}
      }
   }

//----

//----
   return(0);
  }
//+------------------------------------------------------------------+
Comments