SUPER_TREND 2_v1
Download script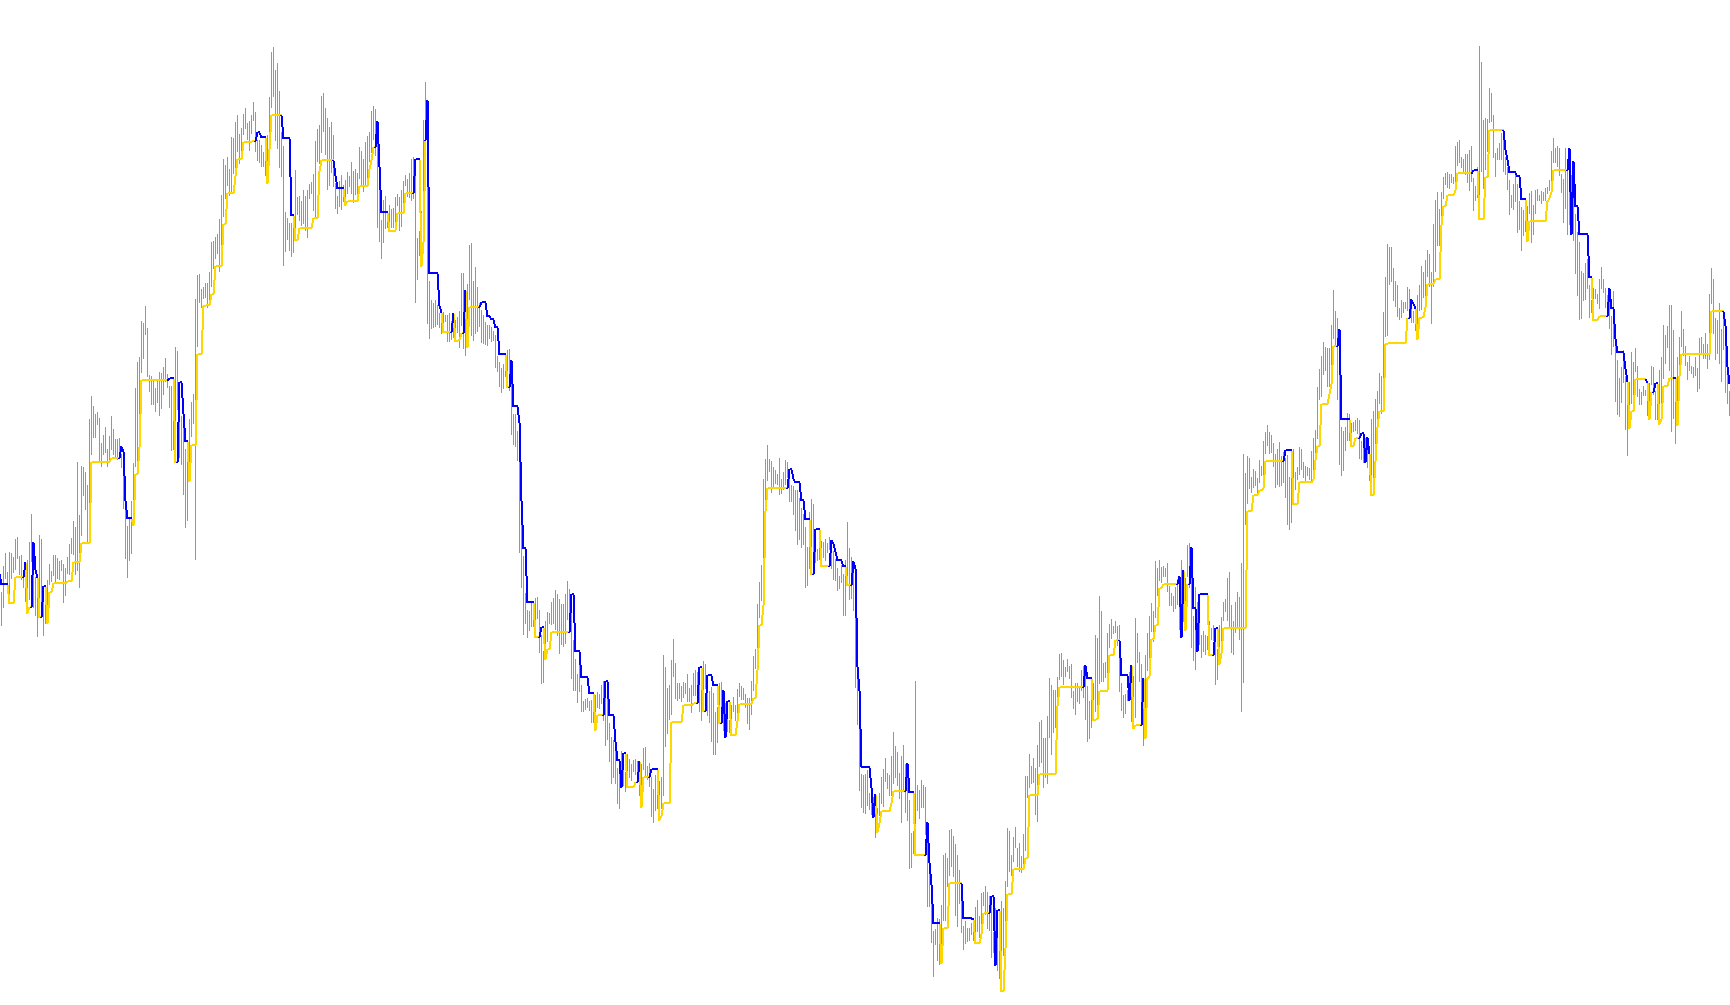
This script is designed to act as a visual trend-following tool for trading charts, specifically providing clear signals on whether the current market direction is bullish (moving up) or bearish (moving down). Instead of relying on a single simple average, it uses a sophisticated combination of momentum analysis and price action logic to determine these shifts.
Dynamic Adaptability
One of the key features of this tool is its ability to adapt automatically to different trading timeframes. Recognizing that a 1-minute chart behaves very differently from a Monthly chart, the script adjusts its internal sensitivity settings based on the timeframe you are viewing. If left on "Automatic," it will select the most appropriate calculation period to ensure the trend signals remain relevant regardless of whether you are scalping or swing trading.
The Core Logic
The indicator operates using two primary layers of verification:
1. Momentum Filtering (CCI Analysis) The script uses a momentum oscillator (the Commodity Channel Index) to "gatekeep" the trend. It looks for specific threshold crossings. By monitoring these shifts, the tool can identify when the underlying momentum of the market has flipped from positive to negative or vice versa. This helps prevent the tool from giving false signals during periods of low volatility or sideways movement.
2. Price Action & Structural Tracking Once the momentum filter provides a direction, the script begins to plot the "Supertrend" lines based on actual price data:
- In an Uptrend: The tool tracks the recent lows of the price candles. It creates a support line that follows these lows, but with a specific "buffer" or "offset." This buffer ensures that minor price fluctuations don't cause the trend line to flicker constantly; it only moves if the market establishes a new structural low.
- In a Downtrend: Conversely, the tool tracks recent highs. It creates a resistance line that follows these peaks. If the price fails to break above a previous high, the line remains steady, providing a visual "ceiling" for the current bearish move.
Visual Behavior
The result is a dynamic line on your chart that stays consistently below the price during an uptrend and consistently above the price during a downtrend. The script effectively "smooths" the market noise by ensuring that the trend line only reacts to significant price movements that break previous boundaries, providing traders with a cleaner, more reliable view of the prevailing market sentiment.
//+------------------------------------------------------------------+
//|                                                   Supertrend.mq4 |
//|                   Copyright © 2005, Jason Robinson (jnrtrading). |
//|                                      http://www.jnrtrading.co.uk |
//+------------------------------------------------------------------+
#property copyright "Copyright © 2005, Jason Robinson (jnrtrading)."
#property link      "http://www.jnrtrading.co.uk"

#property indicator_chart_window
#property indicator_buffers 2
#property indicator_color1 DeepSkyBlue
#property indicator_color2 Yellow  //Red

double TrendUp[];
double TrendDown[];
double NonTrend[];

int st = 0;

int UpDownShift;

extern int TrendCCI_Period = 14;
extern bool Automatic_Timeframe_setting;
extern int M1_CCI_Period = 34;
extern int M5_CCI_Period = 34;
extern int M15_CCI_Period = 14;
extern int M30_CCI_Period = 14;
extern int H1_CCI_Period = 14;
extern int H4_CCI_Period = 6;
extern int D1_CCI_Period = 6;
extern int W1_CCI_Period = 6;
extern int MN_CCI_Period = 6;


//+------------------------------------------------------------------+
//| Custom indicator initialization function                         |
//+------------------------------------------------------------------+
int init()
  {
//---- indicators

   SetIndexStyle(0, DRAW_LINE, 0, 2);
   SetIndexBuffer(0, TrendUp);
   SetIndexStyle(1, DRAW_LINE, 0, 2);
   SetIndexBuffer(1, TrendDown);

   switch(Period()) {
      case 1:     UpDownShift = 3; break;
      case 5:     UpDownShift = 5; break;
      case 15:    UpDownShift = 7; break;
      case 30:    UpDownShift = 8; break;//9
      case 60:    UpDownShift = 21; break;//20
      case 240:   UpDownShift = 34; break;//35
      case 1440:  UpDownShift = 40; break;
      case 10080: UpDownShift = 100; break;
      case 43200: UpDownShift = 120; break;
   }
//----
   return(0);
  }
//+------------------------------------------------------------------+
//| Custor indicator deinitialization function                       |
//+------------------------------------------------------------------+
int deinit()
  {
//----

//----
   return(0);
  }
//+------------------------------------------------------------------+
//| Custom indicator iteration function                              |
//+------------------------------------------------------------------+
int start()
  {
   int limit, i, cciPeriod;
   double cciTrendNow14, cciTrendPrevious14, cciTrendNow,
cciTrendPrevious;

   int counted_bars = IndicatorCounted();
//---- check for possible errors
   if(counted_bars < 0) return(-1);
//---- last counted bar will be recounted
   if(counted_bars > 0) counted_bars--;

   limit=Bars-counted_bars;

   if (Automatic_Timeframe_setting == true) {
      switch(Period()) {
         case 1:     cciPeriod = M1_CCI_Period; break;
         case 5:     cciPeriod = M5_CCI_Period; break;
         case 15:    cciPeriod = M15_CCI_Period; break;
         case 30:    cciPeriod = M30_CCI_Period; break;
         case 60:    cciPeriod = H1_CCI_Period; break;
         case 240:   cciPeriod = H4_CCI_Period; break;
         case 1440:  cciPeriod = D1_CCI_Period; break;
         case 10080: cciPeriod = W1_CCI_Period; break;
         case 43200: cciPeriod = MN_CCI_Period; break;
      }
   }
   else {
      cciPeriod = TrendCCI_Period;
   }
   /*switch(cciPeriod) {
      case 14:  break;
   }*/
   //cciPeriod = TrendCCI_Period;
   SetIndexLabel(0, ("TrendUp " + cciPeriod));
   SetIndexLabel(1, ("TrendDown " + cciPeriod));
   for(i = limit; i >= 0; i--) {

      cciTrendNow = iCCI(NULL, 0, cciPeriod, PRICE_TYPICAL, i) + 70;
      cciTrendPrevious = iCCI(NULL, 0, cciPeriod, PRICE_TYPICAL, i+1) + 70;
      //cciTrendNow50 = iCCI(NULL, 0, 50, PRICE_TYPICAL, i) + 70;
      //cciTrendPrevious50 = iCCI(NULL, 0, 50, PRICE_TYPICAL, i+1) + 70;

      if (cciTrendNow > st && cciTrendPrevious < st) {
         TrendUp[i+1] = TrendDown[i+1];
         //TrendDown[i] = EMPTY_VALUE;
      }

      if (cciTrendNow < st && cciTrendPrevious > st) {
         TrendDown[i+1] = TrendUp[i+1];
         //TrendUp[i] = EMPTY_VALUE;
      }

      if (cciTrendNow > 0) {
         TrendUp[i] = Low[i] - Point*UpDownShift;
         TrendDown[i] = EMPTY_VALUE;
         if (Close[i] < Open[i] && TrendDown[i+1] != TrendUp[i+1]) {
            TrendUp[i] = TrendUp[i+1];
         }
         if (TrendUp[i] < TrendUp[i+1] && TrendDown[i+1] !=
TrendUp[i+1]) {
            TrendUp[i] = TrendUp[i+1];
         }
         if (High[i] < High[i+1] && TrendDown[i+1] != TrendUp[i+1]) {
            TrendUp[i] = TrendUp[i+1];
         }
      }
      else if (cciTrendNow < 0) {
         TrendDown[i] = High[i] + Point*UpDownShift;
         TrendUp[i] = EMPTY_VALUE;
         if (Close[i] > Open[i] && TrendDown[i+1] != TrendUp[i+1]) {
            TrendDown[i] = TrendDown[i+1];
         }
         if (TrendDown[i] > TrendDown[i+1] && TrendDown[i+1] !=
TrendUp[i+1]) {
            TrendDown[i] = TrendDown[i+1];
         }
         if (Low[i] > Low[i+1] && TrendUp[i+1] != TrendDown[i+1]) {
            TrendDown[i] = TrendDown[i+1];
         }
      }
   }

//----

//----
   return(0);
  }
//+------------------------------------------------------------------+
Comments