SuperTrend_32_001
Download script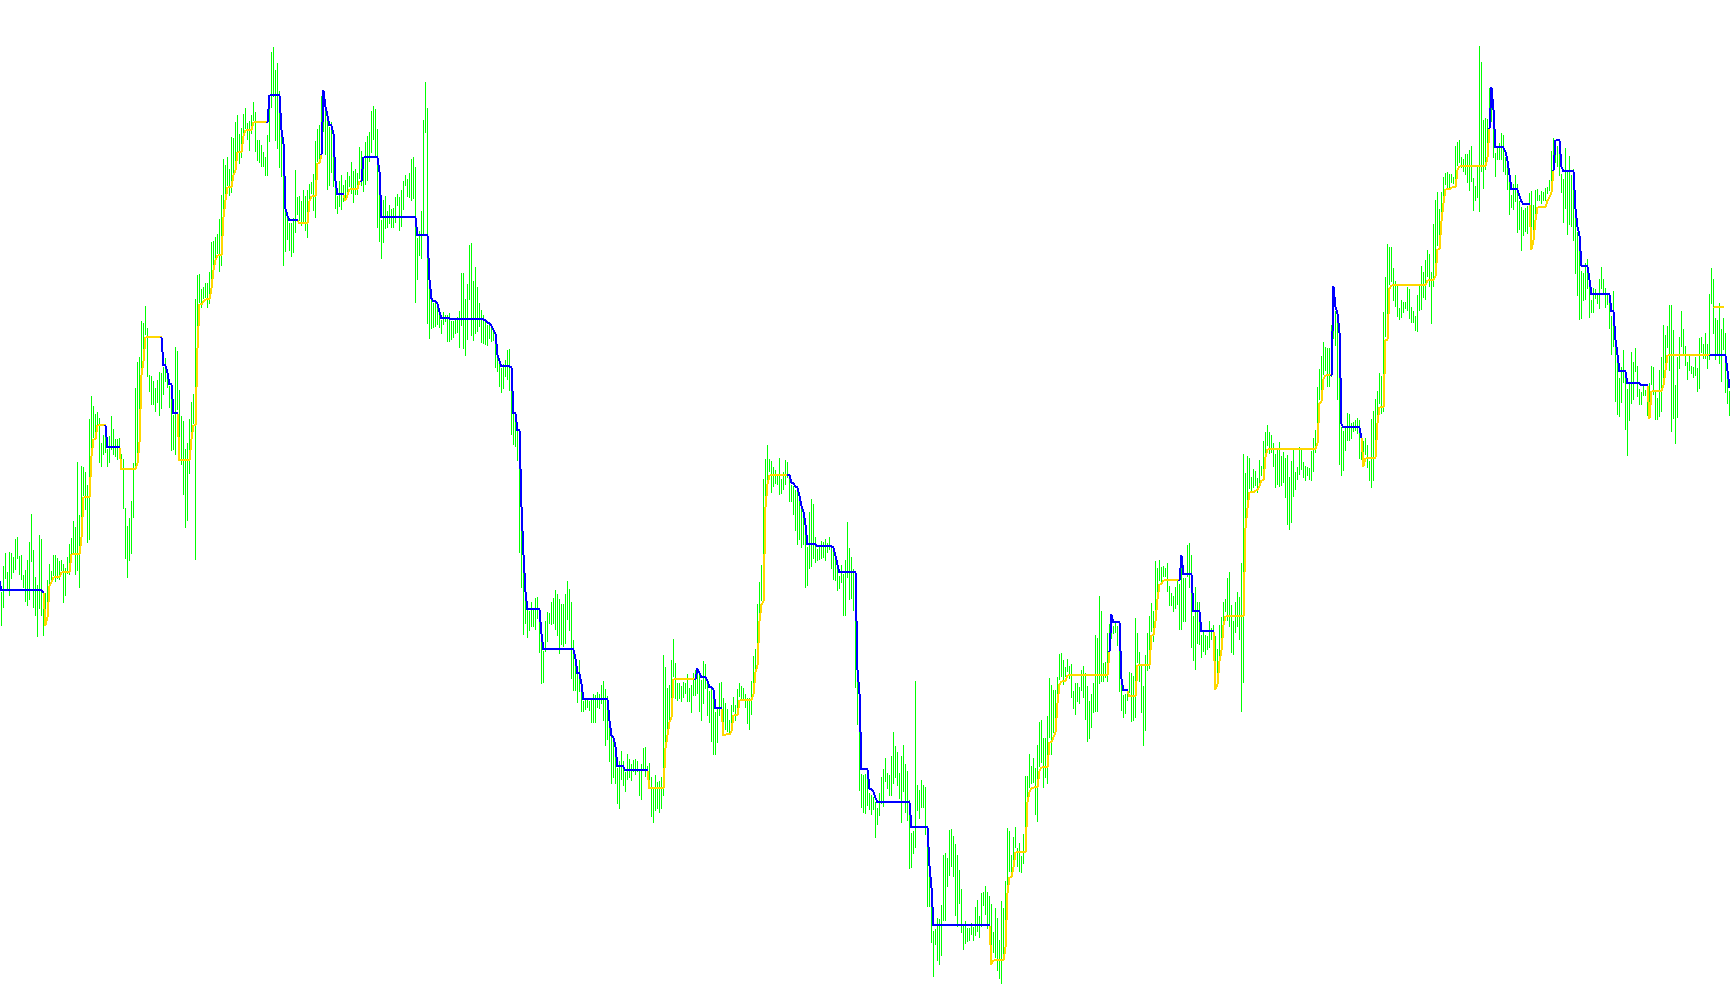
The SuperTrend indicator is designed to provide a clear, visual representation of the current market direction by identifying and smoothing out price action. Its primary goal is to help traders distinguish between "bullish" (upward) and "bearish" (downward) trends in real-time.
Core Logic and Mechanics
The script operates by analyzing three specific types of financial data:
1. Trend Detection via Moving Averages At its foundation, the indicator compares two different moving averages. By looking at the relationship between a current average and a slightly older average, the script determines the momentum of the price.
- If the current average is higher than the previous one, the logic identifies an upward trend.
- If it falls below, a downward trend is signaled.
2. Volatility-Based Buffering (ATR) To prevent the indicator from reacting too wildly to minor market "noise" or random fluctuations, it incorporates a volatility measurement known as ATR (Average True Range).
- In an Upward Trend, the indicator calculates a "support line" based on recent price lows minus a specific amount of volatility.
- In a Downward Trend, it calculates a "resistance line" based on recent price highs plus a similar volatility buffer.
3. Dynamic Price Smoothing (The "Trailing" Effect) One of the key features of this logic is how it handles the lines on your chart. The script ensures that:
- In an Upward Trend, the support line only moves higher; it will never drop lower than its previous position unless the trend officially flips. This creates a "staircase" effect that follows price closely without erratic dipping.
- In a Downward Trend, the resistance line only moves lower; it will never jump upward, ensuring that as price falls, the indicator stays locked to the primary downward path.
Visual Summary for the User
When you observe the indicator on your chart:
- Green Lines (Upward Trend): Represent a zone of support. The script is telling you that the market momentum is bullish and is looking for potential buying opportunities or trend continuation.
- Crimson Lines (Downward Trend): Represent a zone of resistance. The script is signaling that momentum is bearish and identifying levels where the price might face selling pressure.
By combining moving averages for direction, volatility for spacing, and "ratcheting" logic to prevent erratic jumps, the SuperTrend provides a stable visual guide to the market's current path.
//+------------------------------------------------------+\\
//|         SuperTrend_3.mq4 Release 20061022-1          |\\
//|  Copyright © 2005-2006, jnrtrading (Jason Robinson)  |\\
//|   Contact @ http://www.spreadtrade2win.com/forum/    |\\
//+------------------------------------------------------+\\
#property copyright "Copyright © 2005, Jason Robinson (jnrtrading)."
#property link      "http://www.jnrtrading.co.uk"

#property indicator_chart_window
#property indicator_buffers 3
#property indicator_color1 MediumSeaGreen
#property indicator_color2 Crimson

double TrendUp[], TrendDown[], MA[];
double MA1, MA2;
bool trendIsUp;

extern int Nb_Periods = 10;
extern double Multiplier = 2;
/*extern bool Automatic_Timeframe_Settings = false;
extern int M1_Nb_Periods = 10;
extern int M5_Nb_Periods = 10;
extern int M15_Nb_Periods = 12;
extern int M30_Nb_Periods = 10;
extern int H1_Nb_Periods = 10;
extern int H4_Nb_Periods = 10;
extern int D1_Nb_Periods = 10;
extern int W1_Nb_Periods = 10;
extern int MN_Nb_Periods = 10;*/
//+------------------------------------------------------------------+
//| Custom indicator initialization function                         |
//+------------------------------------------------------------------+
int init()
  {
//---- indicators

   IndicatorBuffers(3);
   SetIndexBuffer(0, TrendUp);
   SetIndexStyle(0, DRAW_LINE, STYLE_SOLID, 2);
   SetIndexBuffer(1, TrendDown);
   SetIndexStyle(1, DRAW_LINE, STYLE_SOLID, 2);

//----
   return(0);
  }
//+------------------------------------------------------------------+
//| Custor indicator deinitialization function                       |
//+------------------------------------------------------------------+
int deinit()
  {
//----

//----
   return(0);
  }
//+------------------------------------------------------------------+
//| Custom indicator iteration function                              |
//+------------------------------------------------------------------+
int start()
  {
   int limit, i, j, shift;
   //double Price3;
   int counted_bars = IndicatorCounted();
//---- check for possible errors
   if(counted_bars < 0) return(-1);
//---- last counted bar will be recounted
   if(counted_bars > 0) counted_bars--;

   limit=Bars-counted_bars;
   if (Multiplier == 0) Multiplier = 0.1;

   for (i = limit; i >= 0; i--) {
      MA1 = iMA(NULL, 0, Nb_Periods*Multiplier, 0, MODE_EMA, PRICE_TYPICAL, i);
      MA2 = iMA(NULL, 0, Nb_Periods*Multiplier, 0, MODE_EMA, PRICE_TYPICAL, i+Nb_Periods);

      if (MA1 >= MA2) {
         if (TrendDown[i+Nb_Periods+1] != EMPTY_VALUE && TrendUp[i+Nb_Periods+2] != EMPTY_VALUE) {
            TrendDown[i+Nb_Periods+1] = EMPTY_VALUE;
            TrendUp[i+Nb_Periods+1] = TrendUp[i+Nb_Periods+2];
         }
         TrendUp[i+Nb_Periods] = Low[i+Nb_Periods]-iATR(NULL,1,18,i);
         TrendDown[i+Nb_Periods] = EMPTY_VALUE;
         if(TrendDown[i+Nb_Periods+1] != EMPTY_VALUE) TrendUp[i+Nb_Periods+1] = TrendDown[i+Nb_Periods+1];
         if (TrendUp[i+Nb_Periods] < TrendUp[i+Nb_Periods+1] && TrendUp[i+Nb_Periods+1] != TrendDown[i+Nb_Periods+1]) TrendUp[i+Nb_Periods] = TrendUp[i+Nb_Periods+1];
         trendIsUp = true;
      }
      else if (MA1 <= MA2) {
         if (TrendUp[i+Nb_Periods+1] != EMPTY_VALUE && TrendDown[i+Nb_Periods+2] != EMPTY_VALUE) {
            TrendUp[i+Nb_Periods+1] = EMPTY_VALUE;
            TrendDown[i+Nb_Periods+1] = TrendDown[i+Nb_Periods+2];
         }
         TrendDown[i+Nb_Periods] = High[i+Nb_Periods]+iATR(NULL,1,18,i);
         TrendUp[i+Nb_Periods] = EMPTY_VALUE;
         if(TrendUp[i+Nb_Periods+1] != EMPTY_VALUE) TrendDown[i+Nb_Periods+1] = TrendUp[i+Nb_Periods+1];
         if (TrendDown[i+Nb_Periods] > TrendDown[i+Nb_Periods+1] && TrendDown[i+Nb_Periods+1] != TrendUp[i+Nb_Periods+1]) TrendDown[i+Nb_Periods] = TrendDown[i+Nb_Periods+1];
         trendIsUp = false;
      }
   }
   // Fill the gap at the end
   if (trendIsUp == true) {
      //Comment("Trend Is Up");
      for (j = Nb_Periods; j > 0; j--) {
         TrendUp[j] = Low[j]-Point*(Digits*2);
         if (TrendUp[j] < TrendUp[j+1]) {TrendUp[j] = TrendUp[j+1];}
      }
   }
   else {
      //Comment("Trend Is Down");
      for (j = Nb_Periods; j > 0; j--) {
         TrendDown[j] = High[j]+Point*(Digits*2);
         if (TrendDown[j] > TrendDown[j+1]) {TrendDown[j] = TrendDown[j+1];}
      }
   }

//----

//----
   return(0);
  }
//+------------------------------------------------------------------+
Comments