SuperTrend_002
Download script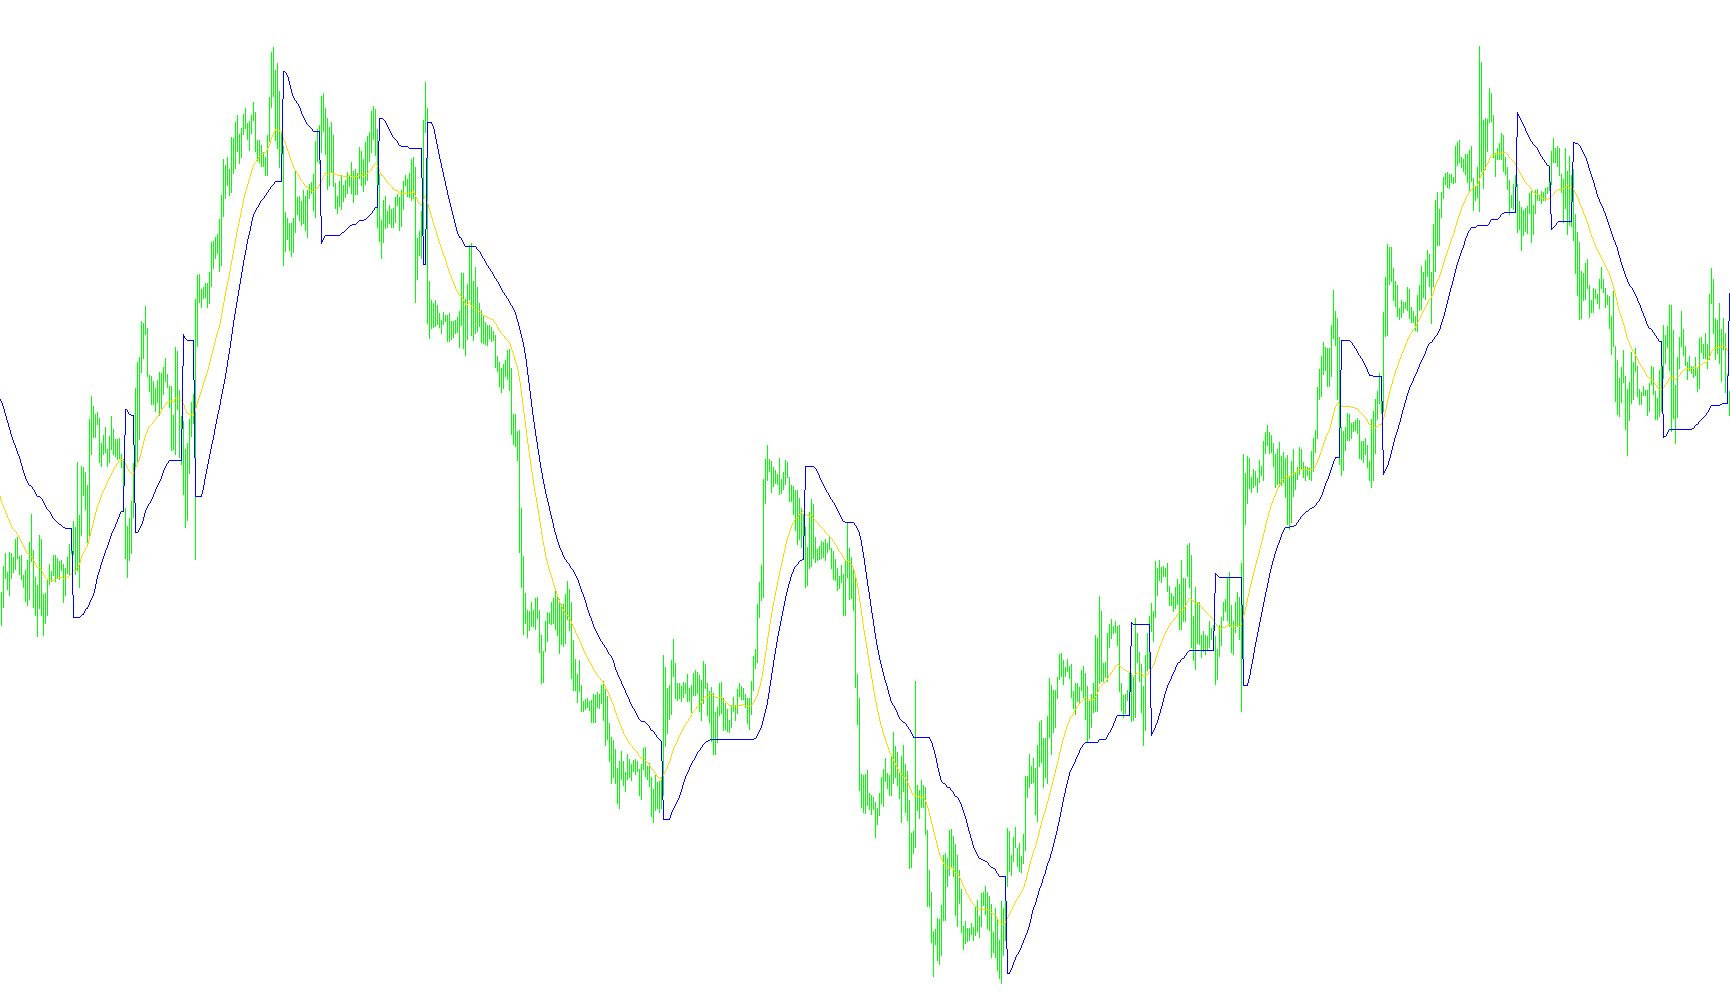
The SuperTrend script is a technical analysis tool designed to help traders identify the current direction of the market and determine potential "stop-loss" levels based on price momentum and volatility. Rather than just looking at a simple moving average, it creates a dynamic line that adjusts automatically as the market becomes more or less erratic.
Here is a breakdown of the logic used by this script:
1. Data Collection and Price Selection
The script begins by gathering essential market data, specifically identifying the highest highs and lowest lows over a set period. It also allows the user to choose which specific price point should be used for calculations—such as the closing price, the midpoint between the high and low, or a weighted average of several different price types. This flexibility ensures the indicator can be tuned to different trading styles.
2. Volatility Measurement
Instead of treating all price movements equally, the script calculates "volatility." It measures the distance between the highest and lowest points in a specific timeframe. By understanding how much the price is swinging, the script can determine how "wide" or "narrow" the trend line should be. In high-volatility markets (where prices swing wildly), the indicator creates more space; in low-volatility markets (where prices are stable), the line tightens.
3. Dynamic Trend Calculation
The core logic combines the average price with the volatility measurement to create two primary boundaries:
- Upper Boundary: A ceiling calculated by adding a multiplier of the volatility to the average price.
- Lower Boundary: A floor calculated by subtracting a multiplier of the volatility from the average price.
Depending on the settings, the script uses different types of mathematical averages (like Simple, Exponential, or Linear Weighted) to smooth out these boundaries, ensuring that the lines don't "flicker" too much due to minor market noise.
4. Trend Identification and Trailing Logic
The script then determines the direction of the trend by comparing the current price to these Upper and Lower boundaries:
- If the price breaks above the upper boundary, a bullish (upward) trend is identified.
- If the price breaks below the lower boundary, a bearish (downward) trend is identified.
To prevent the indicator from creating "false" signals during small pullbacks, the script includes a Trailing Logic feature. This ensures that in an uptrend, the support line only moves up and never down; conversely, in a downtrend, the resistance line only moves down and never up. This creates a "staircase" effect that follows the trend smoothly.
5. Final Output (The Stop Line)
Finally, the script produces a single visible line on the chart.
- During an uptrend, it displays the Lower Boundary as a support level.
- During a downtrend, it displays the Upper Boundary as a resistance level.
This provides the trader with a clear visual cue: as long as the price remains above the line in an uptrend, the trend is considered intact. If the price crosses that line, it signals a potential change in market direction.
//+------------------------------------------------------------------+
//|                                              SuperTrend.mq4 v1   |
//|                   Copyright © 2008, Cyril Dumas                  |
//|                                                                  |
//+------------------------------------------------------------------+
#property copyright "Copyright © 2010, Cyril Dumas."

#property indicator_chart_window
#property indicator_buffers 2
#property indicator_color1 Lime
#property indicator_width1 1
#property indicator_color2 Red
#property indicator_width2 1
/*
#property indicator_color3 Blue
#property indicator_width3 2
#property indicator_color4 Green
#property indicator_width4 2
*/

//---extern
extern int  CalcPriceType = 1;    // type of price calculation over which average will be calculated
extern int  TrendPriceType = 1;   // type of price calculation over which trend direction will be calculated
extern int  VolatPeriod = 3;      // period to look for volatility
extern double  VolatCoeff = 1.8;     // distance from average, multiply of volatility
extern int  AvgToVolatRatio = 10; // period to calculate average, multiply of volatility period
extern int  UpDnCalcType = 6;     // type of calculation for stops

//---- buffers
double AvgPrice[],Stop[];
//double Up[],Dn[];


//+------------------------------------------------------------------+
//| Custom indicator initialization function                         |
//+------------------------------------------------------------------+
int init()
  {
//---- indicators
 //  IndicatorBuffers(11);

   SetIndexBuffer(0, AvgPrice);
   SetIndexStyle(0, DRAW_LINE);
   SetIndexLabel(0, "Average Price");
   SetIndexBuffer(1, Stop);
   SetIndexStyle(1, DRAW_LINE);
   SetIndexLabel(1, "Stop");
   string short_name = "SuperTrend";
   IndicatorShortName(short_name);
/*
   SetIndexBuffer(2, Up);
   SetIndexStyle(2, DRAW_LINE);
   SetIndexLabel(2, "Up");
   SetIndexBuffer(3, Dn);
   SetIndexStyle(3, DRAW_LINE);
   SetIndexLabel(3, "Dn");
   */

//----
   return(0);
  }
//+------------------------------------------------------------------+
//| Custom indicator deinitialization function                       |
//+------------------------------------------------------------------+
int deinit()
  {
//----

//----
   return(0);
  }
//+------------------------------------------------------------------+
//| Custom indicator iteration function                              |
//+------------------------------------------------------------------+
int start()
{

   int limit;
   int i;
   double VolatUpCoeff;
   double VolatDnCoeff;
   double HH[];
   double LL[];
   double CalcPrice[];
   double TrendPrice[];
   double Volat[];
   double AvgVolat[];
   double AvgPeriod;
   double Up[];
   double Dn[];
   double Trend[];
   double temp1[];
   double temp2[];

   int counted_bars=IndicatorCounted();
   //---- check for possible errors
   if(counted_bars<0) return(-1);
   //---- the last counted bar will be recounted
   if(counted_bars>0) counted_bars--;

   VolatUpCoeff = MathAbs(VolatCoeff);
   VolatDnCoeff = -MathAbs(VolatCoeff);
   AvgPeriod = AvgToVolatRatio*VolatPeriod;
   //limit=Bars-counted_bars+AvgPeriod+2;
   limit=Bars;

   //limit=Bars;
   //---- main loop

   ArrayResize( HH, limit); //resize the array to the number of bars
   ArraySetAsSeries(HH,true);
   ArrayResize( LL, limit); //resize the array to the number of bars
   ArraySetAsSeries(LL,true);
   ArrayResize( CalcPrice, limit); //resize the array to the number of bars
   ArraySetAsSeries(CalcPrice,true);
   ArrayResize( TrendPrice, limit); //resize the array to the number of bars
   ArraySetAsSeries(TrendPrice,true);
   ArrayResize( Volat, limit); //resize the array to the number of bars
   ArraySetAsSeries(Volat,true);
   ArrayResize( AvgVolat, limit); //resize the array to the number of bars
   ArraySetAsSeries(AvgVolat,true);
   ArrayResize( Up, limit); //resize the array to the number of bars
   ArraySetAsSeries(Up,true);
   ArrayResize( Dn, limit); //resize the array to the number of bars
   ArraySetAsSeries(Dn,true);
   ArrayResize( Trend, limit); //resize the array to the number of bars
   ArraySetAsSeries(Trend,true);
   ArrayResize( temp1, limit); //resize the array to the number of bars
   ArraySetAsSeries(temp1,true);
   ArrayResize( temp2, limit); //resize the array to the number of bars
   ArraySetAsSeries(temp2,true);


  if(VolatPeriod>0)
  {
      if (limit<=0)
      {
         HH[limit] = High[limit];
         LL[limit] = Low[limit];
      }

      for (i=0;i<limit;i++)
      {
         HH[i] = High[iHighest(NULL,0,MODE_HIGH,VolatPeriod,i)];
         LL[i] = Low[iLowest(NULL,0,MODE_LOW,VolatPeriod,i)];
      }
   }

  if (CalcPriceType == 1)
  {
      for (i=0;i<limit;i++)
         CalcPrice[i]=Close[i];
  }

  if (CalcPriceType == 2)
  {
      for (i =0;i<limit;i++)
         CalcPrice[i]=(HH[i]+LL[i])/2;
  }

  if (CalcPriceType == 3)
  {
      for (i =0;i<limit;i++)
         CalcPrice[i]=(HH[i]+LL[i]+Close[i])/3;
  }

  if (CalcPriceType == 4)
  {
         for (i=0;i<limit;i++)
            CalcPrice[i]=Close[i];
         for (i=(limit-VolatPeriod+1);i>=0;i--)
         {
            CalcPrice[i] = (HH[i]+LL[i]+Close[i]+Low[i+VolatPeriod-1])/4;
         }
  }

  if (CalcPriceType == 5)
  {
         for (i =0;i<limit;i++)
            CalcPrice[i]=Close[i];
         for (i=(limit-VolatPeriod);i>=0;i--)
         {
            CalcPrice[i] = (HH[i]+LL[i]+Close[i+VolatPeriod])/3;
         }
  }

  if (CalcPriceType == 6)
  {
         for (i=0;i<limit;i++)
            CalcPrice[i]=Close[i];
         for (i=(limit-VolatPeriod+1);i>=0;i--)
         {
            CalcPrice[i] = (HH[i]+LL[i]+Close[i+VolatPeriod]+Low[i+VolatPeriod-1])/4;
         }

  }

  if (TrendPriceType == 1)
  {
      for (i=0;i<limit;i++)
         TrendPrice[i]=Close[i];
  }
  if (TrendPriceType == 2)
  {
      for (i=0;i<limit;i++)
         TrendPrice[i]=(HH[i]+LL[i])/2;
  }
  if (TrendPriceType == 3)
  {
      for (i=0;i<limit;i++)
         TrendPrice[i]=(HH[i]+LL[i]+Close[i])/3;
  }
  if (TrendPriceType == 4)
  {
         for (i =0;i<limit;i++)
            TrendPrice[i]=Close[i];
         for (i=(limit-VolatPeriod+1);i>=0;i--)
         {
            TrendPrice[i] = (HH[i]+LL[i]+Close[i]+Low[i+VolatPeriod-1])/4;
         }
  }
  if (TrendPriceType == 5)
  {
         for (i=0;i<limit;i++)
            TrendPrice[i]=Close[i];
         for (i=(limit-VolatPeriod);i>=0;i--)
         {
            TrendPrice[i] = (HH[i]+LL[i]+Close[i+VolatPeriod])/3;
         }
  }
  if (TrendPriceType == 6)
  {
         for (i=0;i<limit;i++)
            TrendPrice[i]=Close[i];
         for (i=(limit-VolatPeriod+1);i>=0;i--)
         {
            TrendPrice[i] = (HH[i]+LL[i]+Close[i+VolatPeriod]+Low[i+VolatPeriod-1])/4;
         }
  }


  for (i =0; i <limit; i++)
  {
      Volat[i] = (HH[i] - LL[i])/2;
      Up[i] = CalcPrice[i];
      Dn[i] = CalcPrice[i];
      Trend[i]=0;
  }


  if (AvgToVolatRatio > 1)
  {
      if (UpDnCalcType==1 || UpDnCalcType==2)
      {
         for (i=0;i<limit;i++)
         {
            AvgPrice[i] = iMAOnArray(CalcPrice,0,AvgPeriod,0,MODE_SMA,i);
            AvgVolat[i] = iMAOnArray(Volat,0,AvgPeriod,0,MODE_SMA,i);
            Up[i] = AvgPrice[i]+VolatUpCoeff*AvgVolat[i];
            Dn[i] = AvgPrice[i]+VolatDnCoeff*AvgVolat[i];
         }
      }
      if (UpDnCalcType==3 || UpDnCalcType==4)
      {
         for (i=0;i<limit;i++)
         {
            AvgPrice[i] = iMAOnArray(CalcPrice,0,AvgPeriod,0,MODE_EMA,i);
            AvgVolat[i] = iMAOnArray(Volat,0,AvgPeriod,0,MODE_EMA,i);
            Up[i] = AvgPrice[i]+VolatUpCoeff*AvgVolat[i];
            Dn[i] = AvgPrice[i]+VolatDnCoeff*AvgVolat[i];
         }
      }
      if (UpDnCalcType==5 || UpDnCalcType==6)
      {
         for (i=0;i<limit;i++)
         {
            AvgPrice[i] = iMAOnArray(CalcPrice,0,AvgPeriod,0,MODE_LWMA,i);
            AvgVolat[i] = iMAOnArray(Volat,0,AvgPeriod,0,MODE_LWMA,i);
            Up[i] = AvgPrice[i]+VolatUpCoeff*AvgVolat[i];
            Dn[i] = AvgPrice[i]+VolatDnCoeff*AvgVolat[i];
         }
      }
      if (UpDnCalcType==7 || UpDnCalcType==8)
      {
         for (i=0;i<limit;i++)
            temp1[i] = 2*iMAOnArray(CalcPrice,0,MathRound(AvgPeriod/2),0,MODE_LWMA,i)-iMAOnArray(CalcPrice,0,AvgPeriod,0,MODE_LWMA,i);
         for (i=0;i<limit;i++)
            temp2[i] = 2*iMAOnArray(Volat,0,MathRound(AvgPeriod/2),0,MODE_LWMA,i)-iMAOnArray(Volat,0,AvgPeriod,0,MODE_LWMA,i);
         for (i=0;i<limit;i++)
         {
            AvgPrice[i] = iMAOnArray(temp1,0,MathRound(MathSqrt(AvgPeriod)),0,MODE_LWMA,i);
            AvgVolat[i] = iMAOnArray(temp2,0,MathRound(MathSqrt(AvgPeriod)),0,MODE_LWMA,i);
            Up[i] = AvgPrice[i]+VolatUpCoeff*AvgVolat[i];
            Dn[i] = AvgPrice[i]+VolatDnCoeff*AvgVolat[i];
         }
      }
  }
  else
  {
      for (i=0;i<limit;i++)
      {
         AvgPrice[i] = CalcPrice[i];
         Up[i] = CalcPrice[i]+VolatUpCoeff*Volat[i];
         Dn[i] = CalcPrice[i]+VolatDnCoeff*Volat[i];
      }
  }

    for (i=(limit-AvgPeriod-1);i>=0;i--)
    {
         if (AvgToVolatRatio > 1 && (UpDnCalcType == 2 || UpDnCalcType == 4 || UpDnCalcType == 6 || UpDnCalcType == 8))
         {
            if (Trend[i+1] < 0)
            {
               if (Up[i] > Up[i+1])
                  Up[i] = Up[i+1];
            }
            if (Trend[i+1] >= 0)
            {
               if (Dn[i]<Dn[i+1])
                  Dn[i] = Dn[i+1];
            }
         }

         Trend[i] = Trend[i+1];
         if (TrendPrice[i] > Up[i])
            Trend[i] = 1;
         if (TrendPrice[i] < Dn[i])
            Trend[i] = -1;
    }

    for (i=(limit-AvgPeriod);i>=0;i--)
    {
      if (Trend[i] >= 0)
         Stop[i] = Dn[i];
      else
         Stop[i] = Up[i];
    }

//----
   return(0);
  }
//+------------------------------------------------------------------+
Comments