SuperTrend nrp new MTF
Download script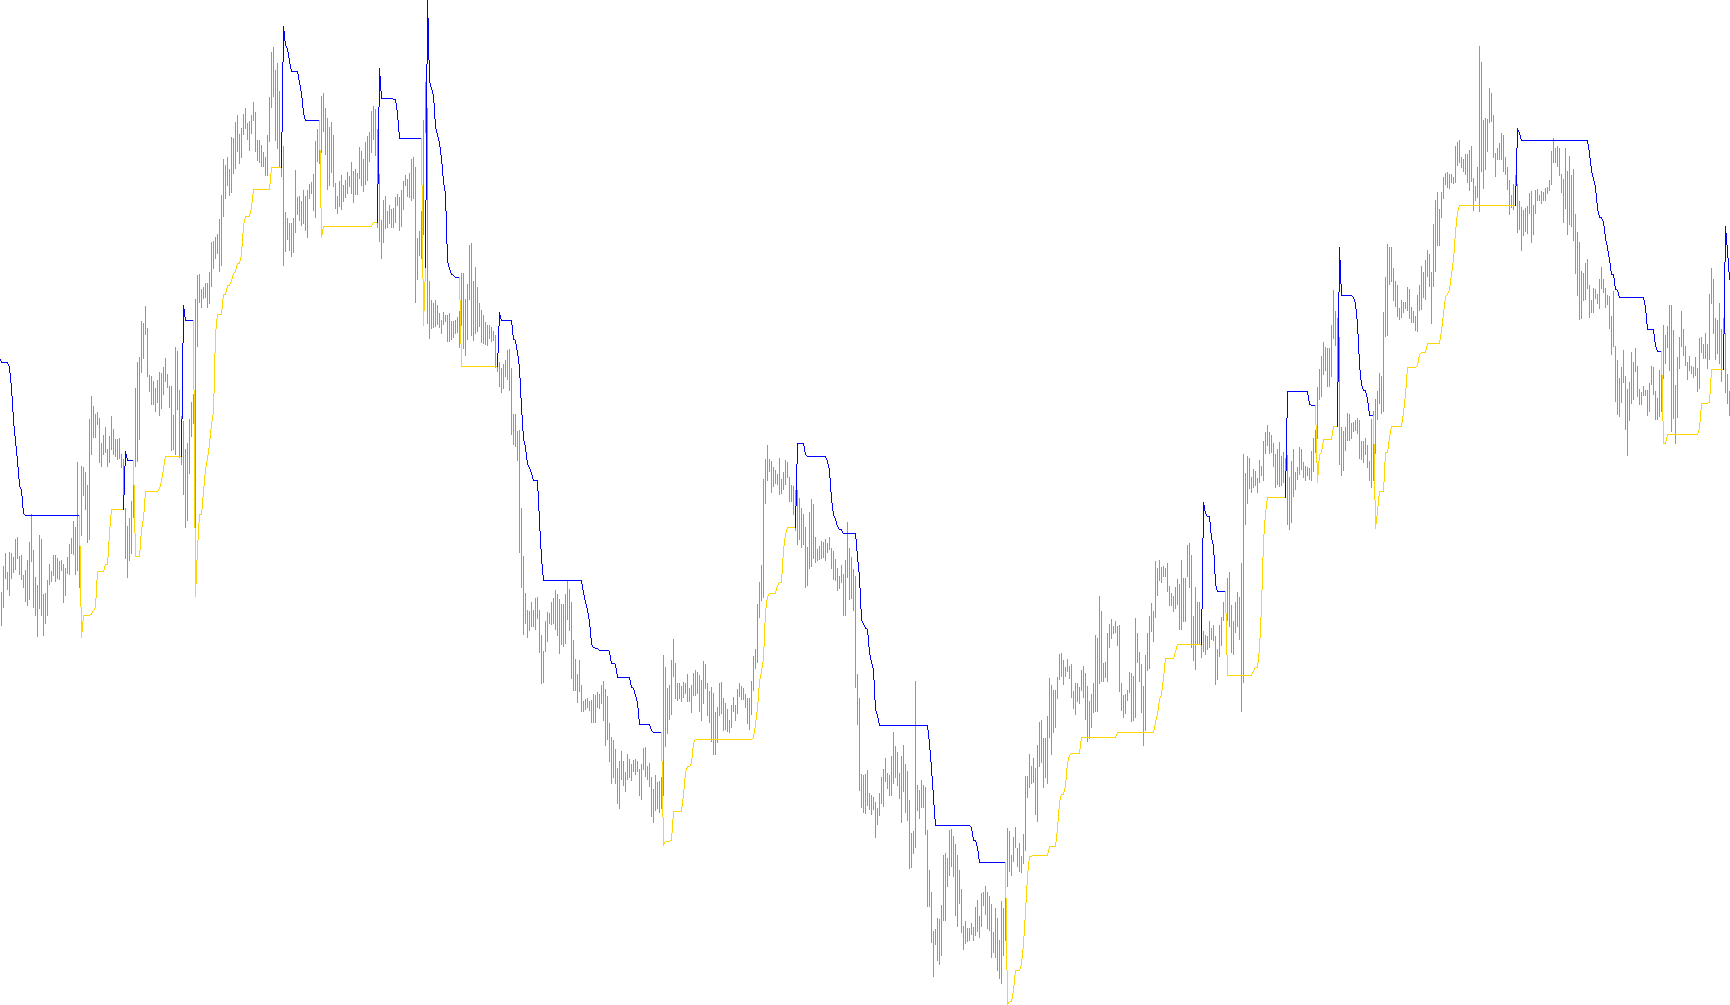
This script functions as a dynamic trend-following indicator designed to help traders identify the prevailing direction of the market (bullish or bearish) while filtering out minor price fluctuations. By calculating a "SuperTrend" line, it provides a visual signal of whether the current market environment is moving upward or downward.
Core Logic and Methodology
The indicator operates by combining three primary types of market data: price movement, volatility, and moving averages. Here is how it processes that information:
1. Volatility Assessment The tool constantly measures market volatility using a standard calculation (ATR). By understanding how much the price typically swings within a specific period, the script establishes a "buffer zone." This prevents the indicator from reacting to tiny, insignificant price jitters, ensuring that only meaningful moves trigger a trend change.
2. Dynamic Boundary Calculation The script calculates two theoretical boundaries for the price: an upper bound and a lower bound.
- It determines these bounds by taking the average price of a candle and adding or subtracting a specific multiple of the volatility (the buffer zone).
- These boundaries act as "floors" or "ceilings" that the price must interact with to confirm a trend shift.
3. Trend Detection and Filtering The indicator looks at the relationship between the current closing price and these calculated boundaries:
- Bullish Signal: If the price closes above the upper boundary, the script recognizes an upward trend.
- Bearish Signal: If the price closes below the lower boundary, it recognizes a downward trend.
To ensure the line remains smooth and consistent, the logic includes a "memory" feature. Instead of jumping erratically, the indicator tracks previous boundaries. For example, in an uptrend, it ensures the "floor" never moves down; in a downtrend, it ensures the "ceiling" never moves up. This creates a steady, continuous line that only shifts when a significant trend reversal occurs.
4. Visual Output The final result is a smoothed trend line plotted on your chart. When the price stays consistently above the line, the market is viewed as being in an appreciative state. Conversely, when the price remains below the line, it signals a bearish environment. The script also includes specific logic to manage how these lines are drawn and "cleaned" on the chart, ensuring that the visual transitions between trend shifts are distinct and easy for the trader to read.
//+------------------------------------------------------------------+
//|                                               SuperTrend nrp.mq4 |
//|                                                           Mladen |
//+------------------------------------------------------------------+
#property copyright "mladen"
#property link      "mladenfx@gmail.com"

#property indicator_chart_window
#property indicator_buffers 3
#property indicator_color1 Magenta
#property indicator_color2 DarkOrange
#property indicator_color3 Gold

extern int    period       = 10;
extern int    appliedPrice = PRICE_CLOSE;
extern double multiplier   = 3.0;
extern int    TimeFrame    = 0; //default chart TF :: Use 5, 15, 30, 60, etc...
//
//
//
//
//

double Trend[];
double TrendDoA[];
double TrendDoB[];
double Direction[];
double Up[];
double Dn[];

//+------------------------------------------------------------------+
//|                                                                  |
//+------------------------------------------------------------------+
//
//
//
//
//

int init()
{
   IndicatorBuffers(6);
      SetIndexBuffer(0, Trend);
      SetIndexBuffer(1, TrendDoA);
      SetIndexBuffer(2, TrendDoB);
      SetIndexBuffer(3, Direction);
      SetIndexBuffer(4, Up);
      SetIndexBuffer(5, Dn);

      SetIndexLabel(0,"SuperTrend");
      SetIndexLabel(1,"SuperTrend");
      SetIndexLabel(2,"SuperTrend");
   IndicatorShortName("SuperTrend");
   period = MathMax(1,period);
}
int deinit()
{
   return(0);
}


//+------------------------------------------------------------------+
//|                                                                  |
//+------------------------------------------------------------------+
//
//
//
//
//

int start()
{
   int counted_bars = IndicatorCounted();
   int limit,i;

   if(counted_bars < 0) return(-1);
   if(counted_bars > 0) counted_bars--;
           limit = Bars-counted_bars;

   //
   //
   //
   //
   //

   if (Direction[limit] <= 0) CleanPoint(limit,TrendDoA,TrendDoB);
   for(i = limit; i >= 0; i--)
   {
         double atr    = iATR(NULL,TimeFrame,period,i);
         double cprice = iMA(NULL,TimeFrame,1,0,MODE_SMA,appliedPrice,i);
         double mprice = (High[i]+Low[i])/2;
                Up[i]  = mprice+multiplier*atr;
                Dn[i]  = mprice-multiplier*atr;

         //
         //
         //
         //
         //

         Direction[i] = Direction[i+1];
            if (cprice > Up[i+1]) Direction[i] =  1;
            if (cprice < Dn[i+1]) Direction[i] = -1;
         TrendDoA[i] = EMPTY_VALUE;
         TrendDoB[i] = EMPTY_VALUE;
            if (Direction[i] > 0) { Dn[i] = MathMax(Dn[i],Dn[i+1]); Trend[i] = Dn[i]; }
            else                  { Up[i] = MathMin(Up[i],Up[i+1]); Trend[i] = Up[i]; PlotPoint(i,TrendDoA,TrendDoB,Trend); }
   }
   return(0);
}


//+------------------------------------------------------------------+
//|                                                                  |
//+------------------------------------------------------------------+
//
//
//
//
//

void CleanPoint(int i,double& first[],double& second[])
{
   if ((second[i]  != EMPTY_VALUE) && (second[i+1] != EMPTY_VALUE))
        second[i+1] = EMPTY_VALUE;
   else
      if ((first[i] != EMPTY_VALUE) && (first[i+1] != EMPTY_VALUE) && (first[i+2] == EMPTY_VALUE))
          first[i+1] = EMPTY_VALUE;
}

//
//
//
//
//

void PlotPoint(int i,double& first[],double& second[],double& from[])
{
   if (first[i+1] == EMPTY_VALUE)
      {
      if (first[i+2] == EMPTY_VALUE) {
          first[i]    = from[i];
          first[i+1]  = from[i+1];
          second[i]   = EMPTY_VALUE;
         }
      else {
          second[i]   = from[i];
          second[i+1] = from[i+1];
          first[i]    = EMPTY_VALUE;
         }
      }
   else
      {
         first[i]   = from[i];
         second[i]  = EMPTY_VALUE;
      }
}
Comments